DRI Analytics
Welcome to the DRI Analytics Documentation portal!
To create a ticket on the KenWave’s Service Desk, click on the link KenWave Service Desk.
Start with the documentation or select one of the sections below:
Sections:
Overview
This section provides an overall overview of the KenWave Solutions company and the DRI Analytics web application.
KenWave Solutions
KenWave Solutions has established itself as a leading provider of data-driven solutions aimed at closing the buried asset information gap. The company’s technology supports asset managers by providing reliable information on pipe stiffness, wall conditions, leaks, air pockets, and other anomalies to save utilities time, money, and water.
KenWave Technology utilizes Dynamic Response ImagingTM technique, which supports asset managers by providing reliable information on pipe wall conditions, leaks, air pockets, and other anomalies at an affordable cost without the risks and dangers of invasive inspection.
Non-invasive condition assessment, loss mitigation and leak detection can and must be a safe, simple, scalable process to provide maximum network coverage and savings. KenWave Technology delivers on all counts.
DRI Analytics App
DRI Analytics is a web application developed by KenWave Solutions that provides two main functionalities:
Management of Inspections – the application allows companies to control users, projects, and devices, providing an overall management of the company work on a concise dashboard.
Data-Processing – Comparison between the models and on-site measurements to deduce wall properties and anomaly locations on-site using the online DRI Analytics online platform. Results are then validated by the KenWave data analysis team and returned to the client.
Using the data and its analysis, KenWave database and modeling algorithms are updated to make the next inspections more accurate.
DRI Analytics web application demands the following resources to process the data:
Data Acquisition Units (DAU) – collects the input data from the dynamic response sensors.
Laptop Computer – runs the DRI Analytics application on-site and allow the field team to send the data from the DAUs to KenWave servers.
Internet Connection – provides access to the system on-site and allows the field team to send data from the DAUs to the KenWave servers.
KenWave Solutions Servers – stores and process the data to analyze pipe stiffness, wall conditions, leaks, air pockets, and other anomalies.
Using the data and its analysis, KenWave database and modeling algorithms are frequently updated to make the next inspections more accurate. The diagram below shows the DRI Analytics app in a typical field teamwork.
System Requirements
The DRI Analytics web application demands the following resources to process the data:
Data Acquisition Units (DAU) – collects the input data from the dynamic response sensors.
Laptop Computer – runs the DRI Analytics application on-site and allow the field team to send the data from the DAUs to KenWave servers.
Internet Connection – provides access to the system on-site and allows the field team to send data from the DAUs to the KenWave servers.
KenWave Solutions Servers – stores and process the data to analyze pipe stiffness, wall conditions, leaks, air pockets, and other anomalies.
Site Map
To start using the DRI Analytics webapp, it is necessary to enter the user credentials on the Login page.
After the authorization process, the Dashboard page shows general information such as the current Projects, registered Devices, and user’s profile. Moreover, the other parts of the application will be available for the user, depending on the level of authorization they have to access.
DRI Analytics web application has the following site map:

The main web pages of the application are depicted on the following topics:
Dashboard
Companies
Projects
Users
Devices
Each of these pages will be covered in this documentation.
Dashboard
The Dashboard page shows general information about the topics listed below.
Click on one of the links above to visit the topic’s documentation page.
The Dashboard page has the overall visualization presented in the figure below.
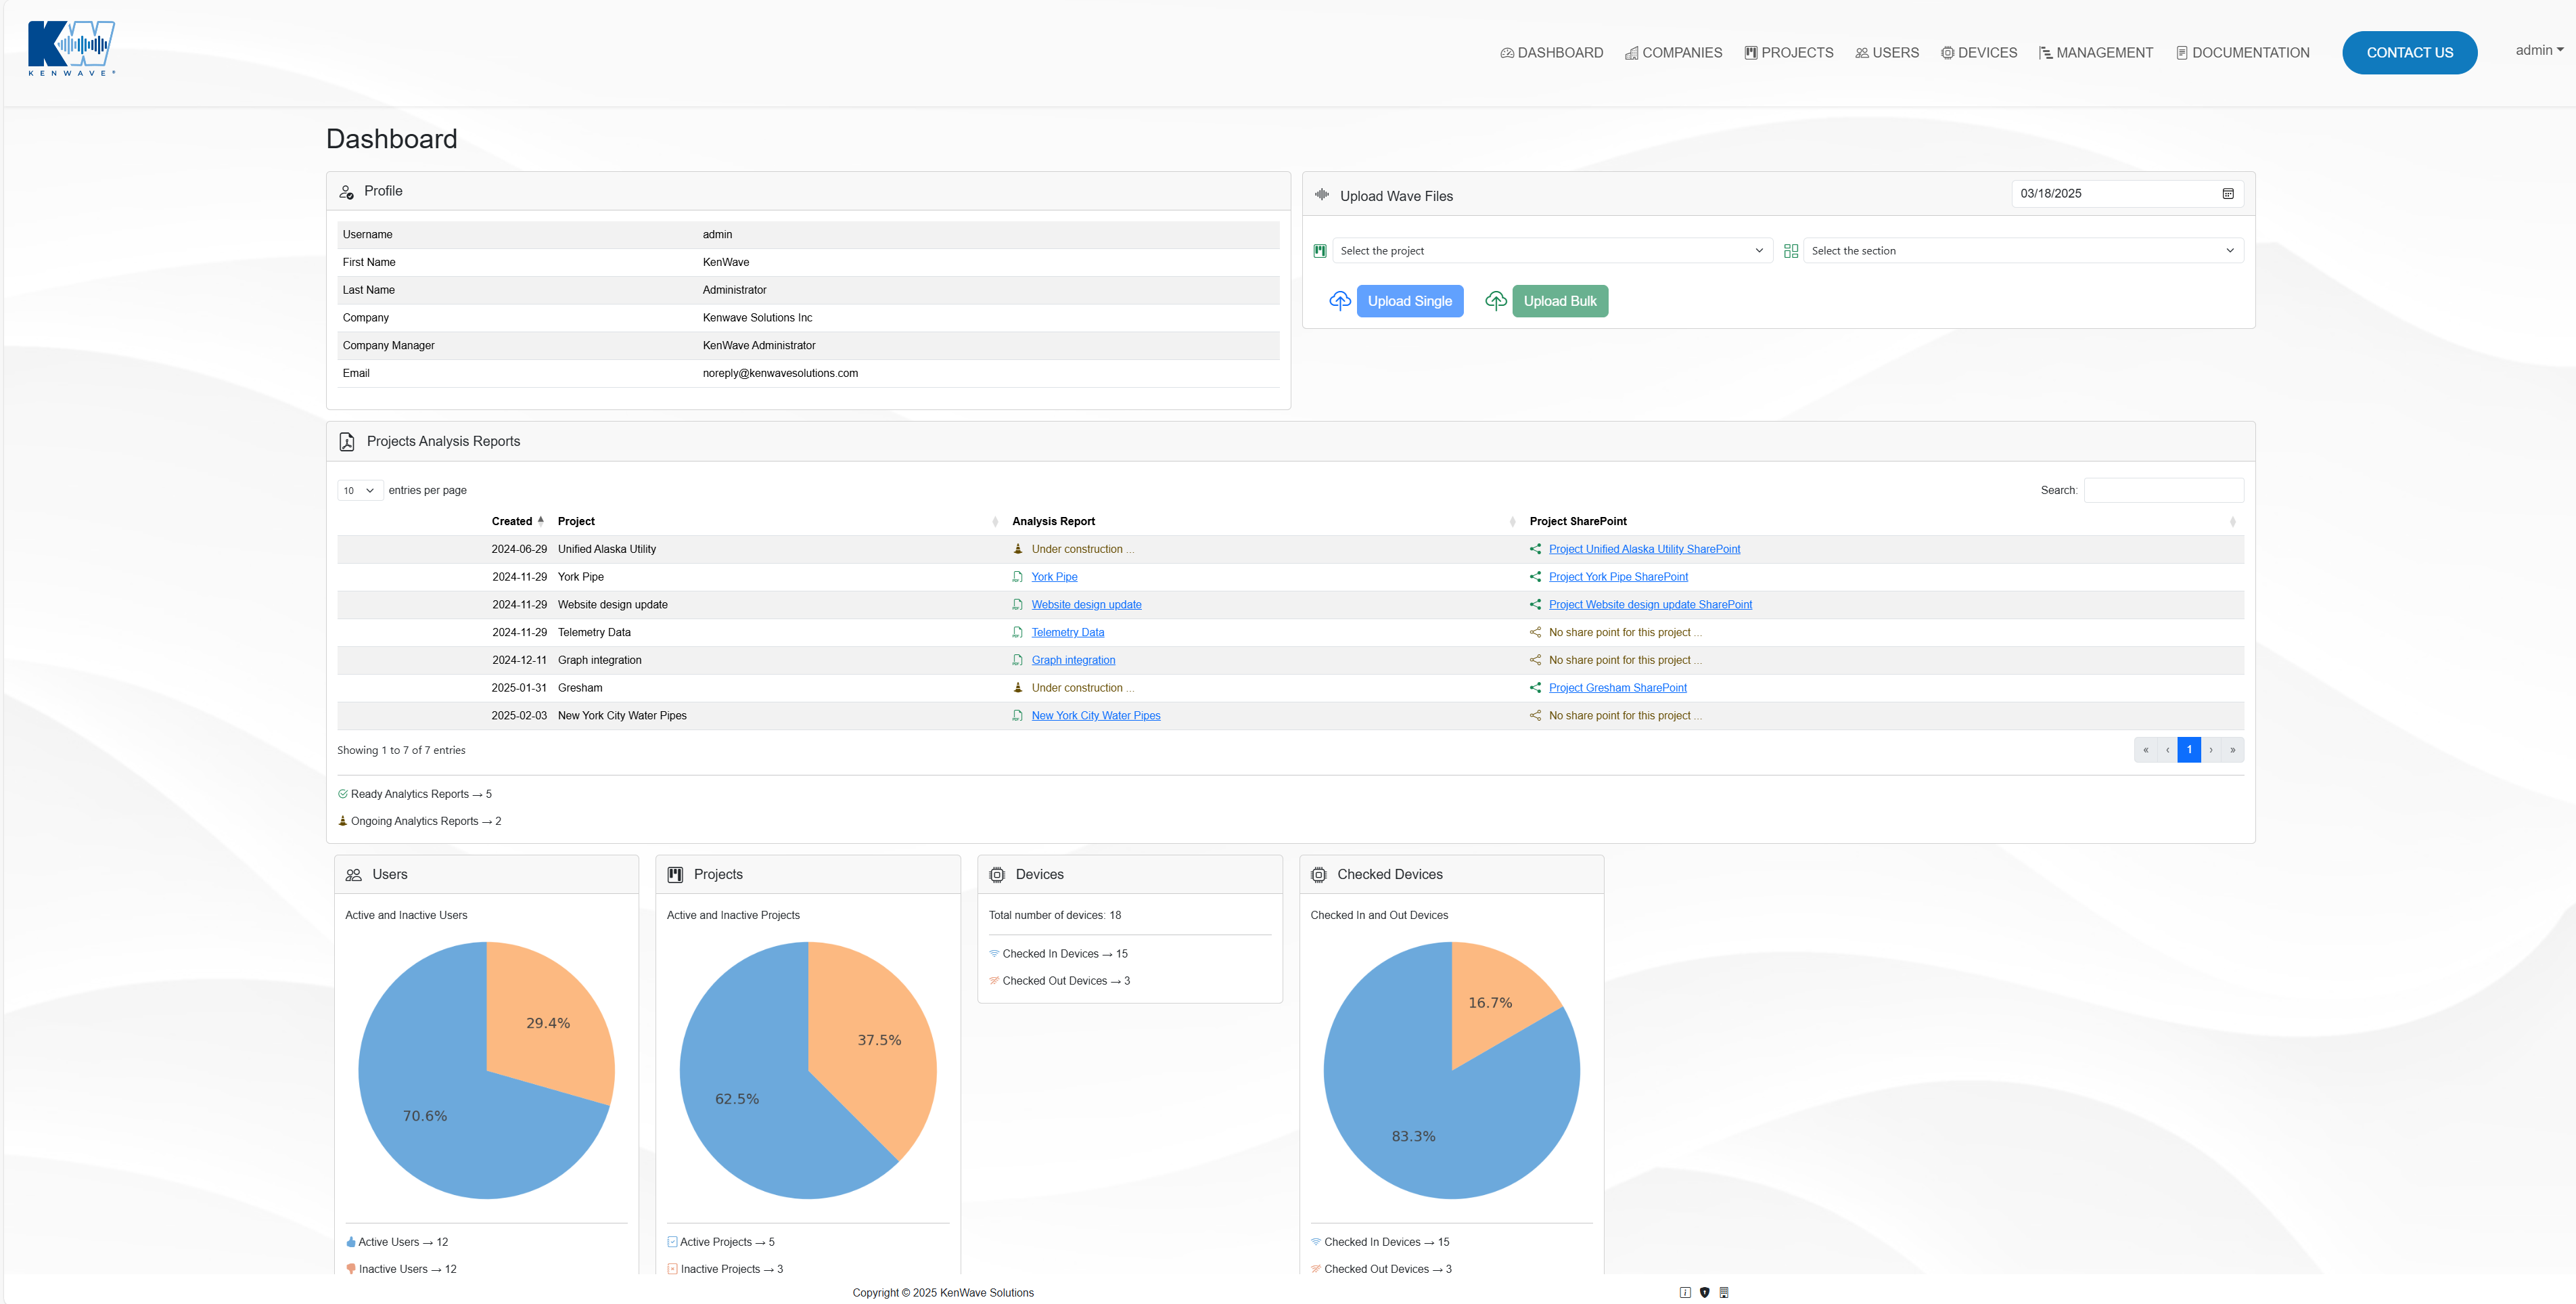
The Dashboard page shows the following panels:
Profile → information about the user’s profile.
Upload Wave Files → to upload a single file using the Upload Single button or a group of files at once, using the Upload Bulk button.
Project Analysis Reports → to access the project’s analysis report on the Analysis Report column or to access the project SharePoint folder on the column of the same name.
Users → information about the amount of Active and Inactive users.
Projects → information about the amount of Active and Inactive projects.
Devices → information about the total number of Devices and the number of checked in and out devices.
Companies
The Companies page allows the management of the registered companies, displaying a list of them in the DRI Analytics application.
To create a new company, click on the button Create Company pointed in the figure below.
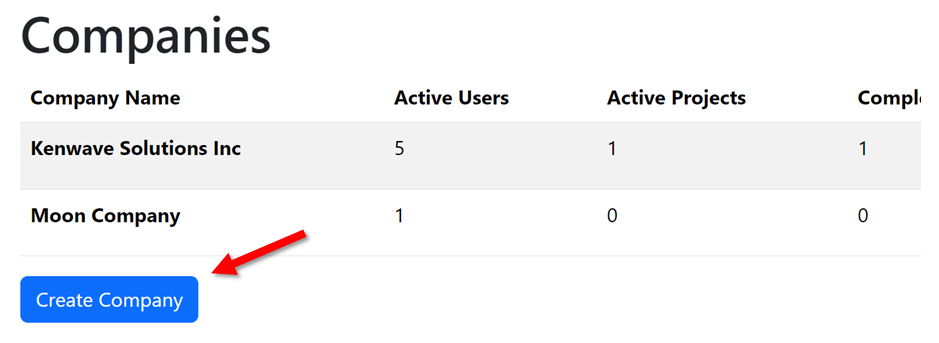
Then, follow the how to Create a New Company procedure link below. After that, the new company will be displayed in the companies list.
How To Create a New Company
For each company in the list, the following information is available:
Company Name
Active Users
Active Projects
Completed Projects
Actions
Click on the button Enable to enable it and allow editing a disabled company in the list, like in the example below:
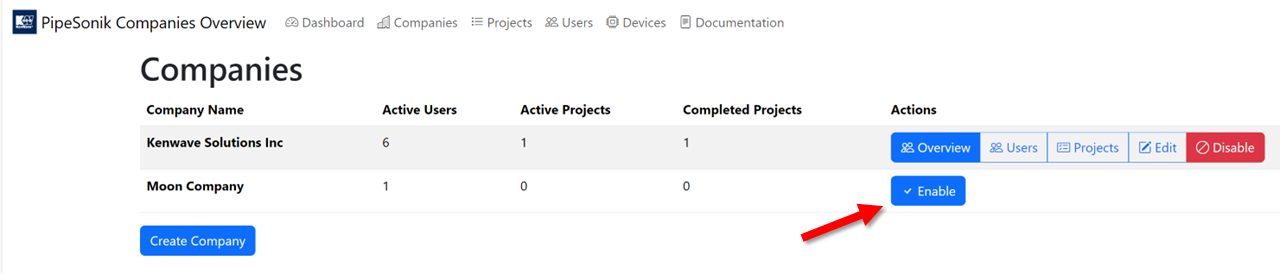
To disable a company, click on the red button Disable. Depending on the status of the company, the column Actions displays a list of available commands.
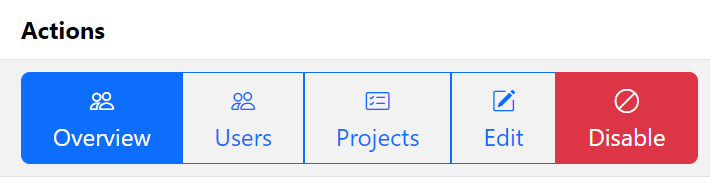
If the user is enabled, the following buttons will be available. Click on the links below to visit each button’s documentation page.
The figure below displays the Action column’s buttons for an active company:
Projects
The Projects page shows general information about all registered companies projects in a list with the following information:
Name
Description
Status
Creation Date
End Date
Manager
Company
To create a new project, click on the button Create Project pointed in the figure below.
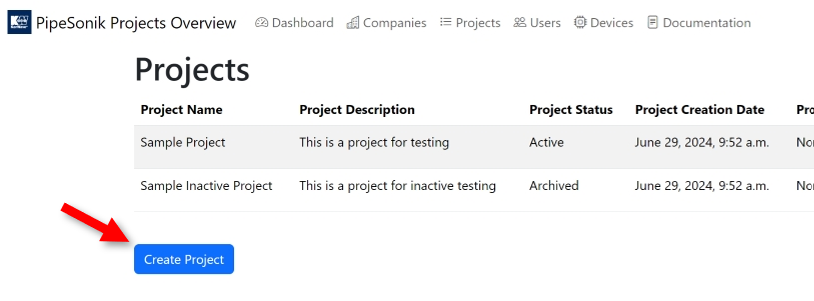
Then follow the how to Create a new Project procedure link below. After that, the new project will be displayed in the projects list.
How To Create a New Project
In addition, the last column Actions displays three buttons for an active company.
Buttons:
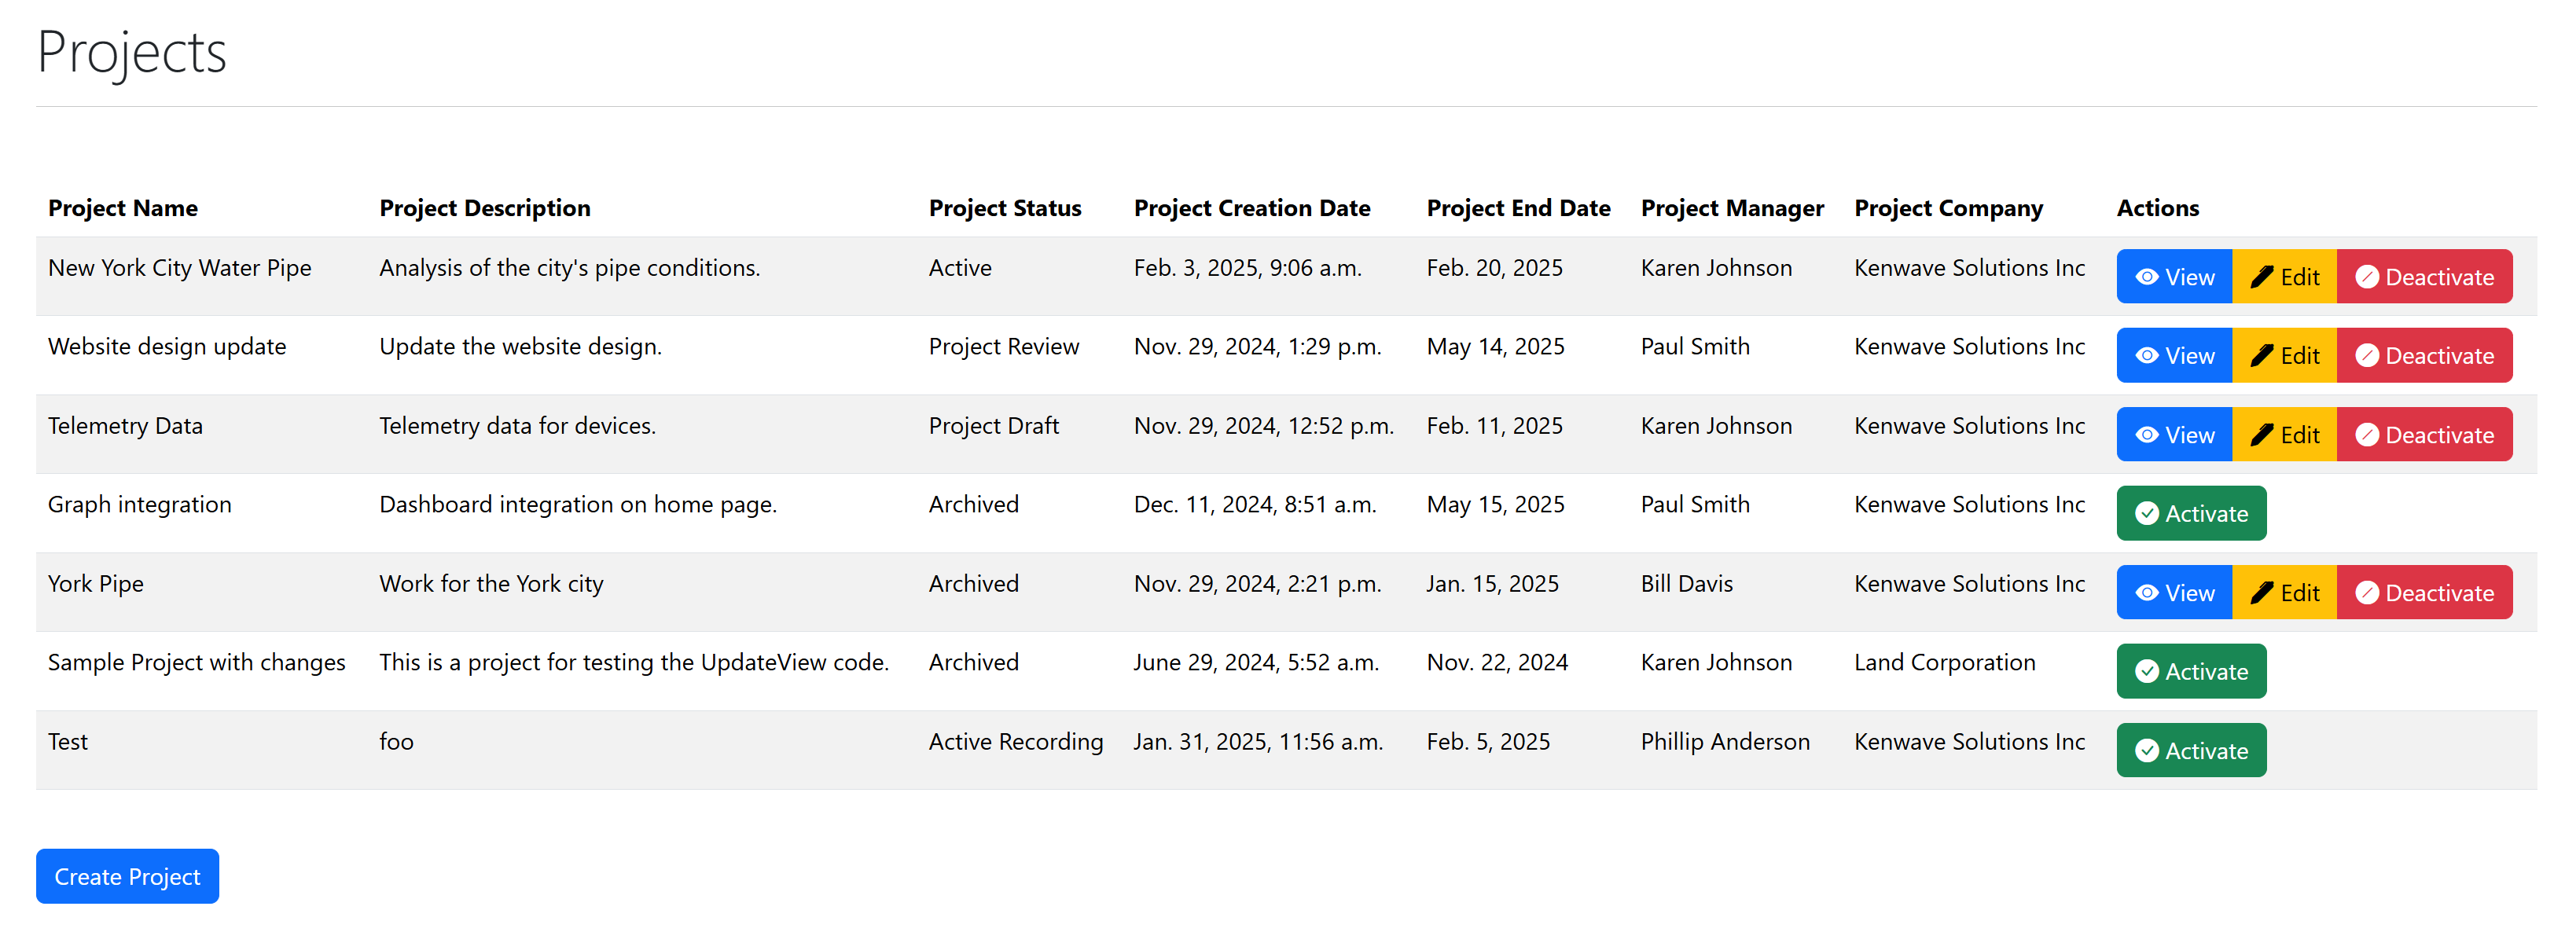
In the figure above, the active projects have their Actions columns with the three buttons View, Edit, and Deactivate. So, only active projects have these options.
On the other hand, deactivated projects show only the green Activate button.
Reports Management:
Users
The Users page lists all the users registered in the DRI Analytics web application, with the following information:
User Name
Company
Manager
Active
Role
E-mail
Active Until
Last Login
Actions
The figure below displays an Users page example.
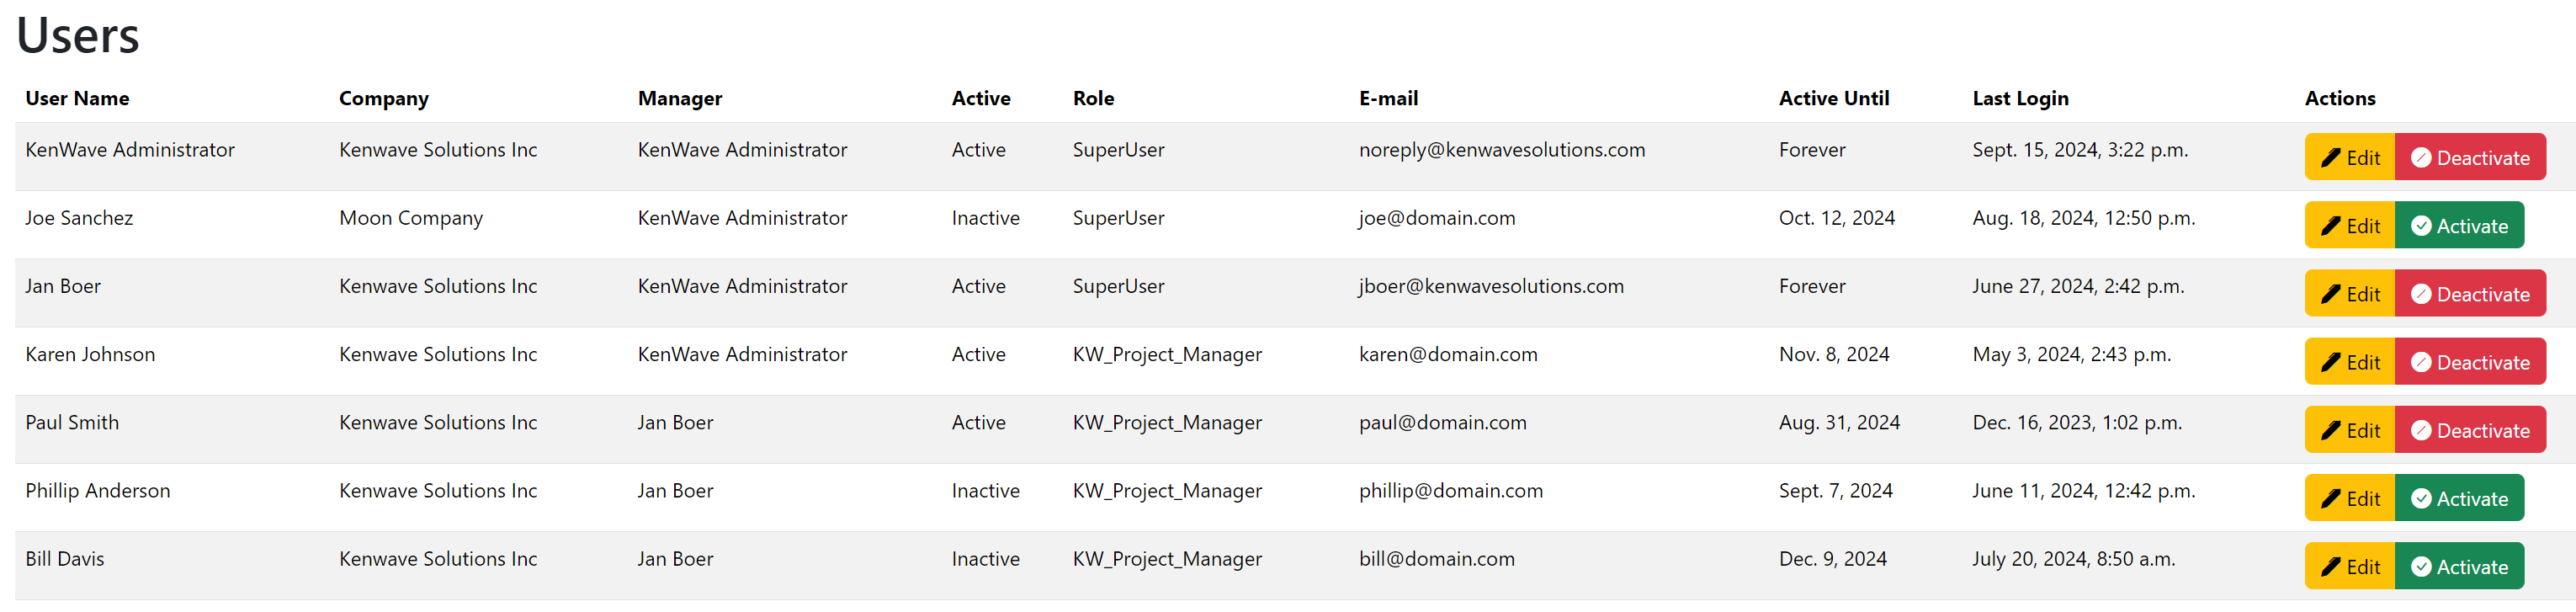
In addition, the last column Actions displays two buttons for each user. Click on each topic to see further information.
Buttons:
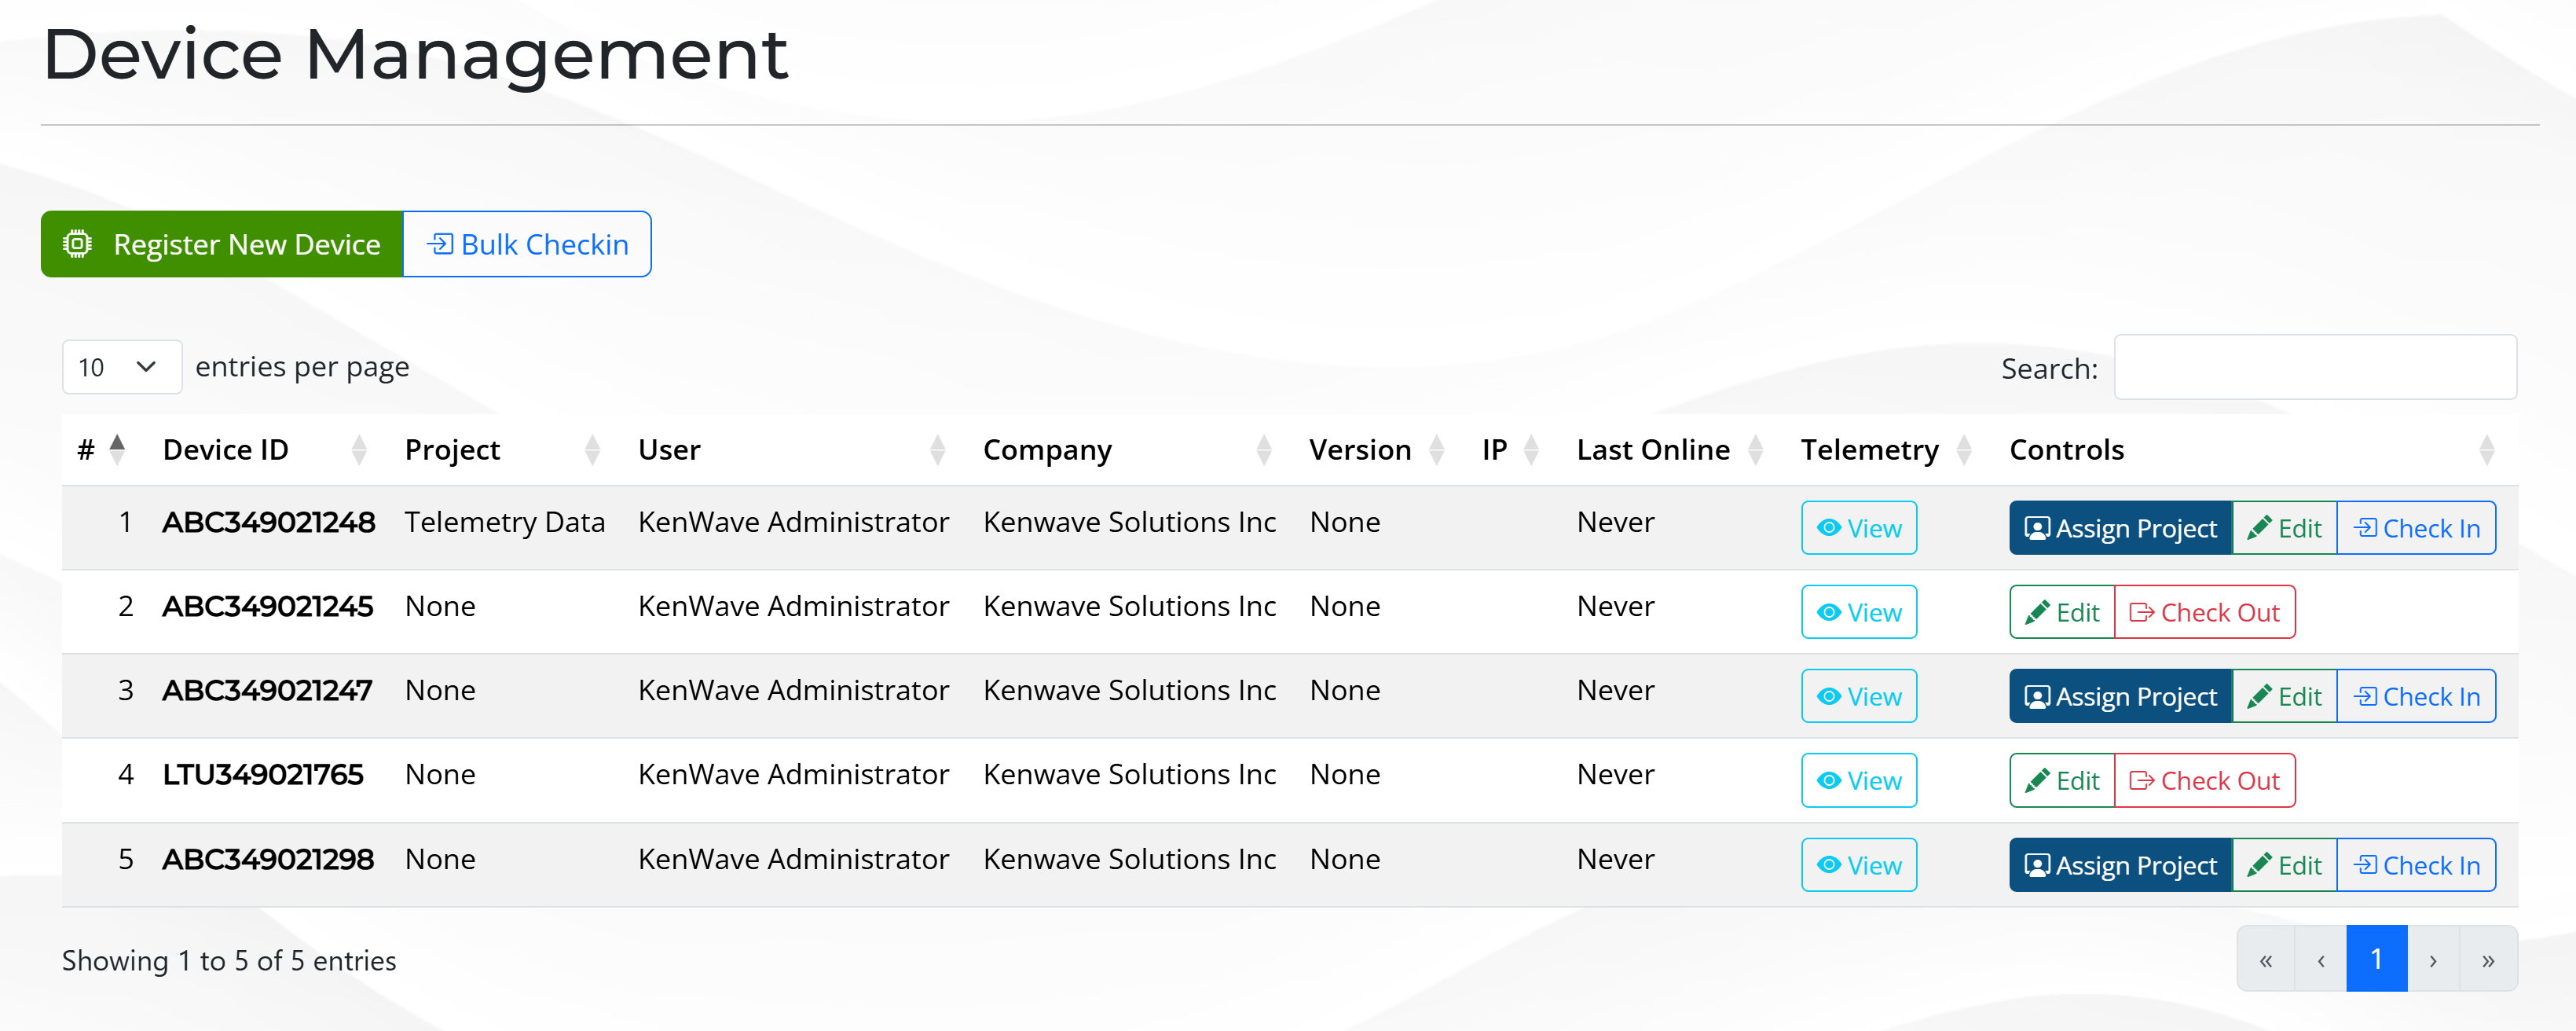
Devices
The Devices page shows information about the registered devices on the DRI Analytics system.
To register a new device, click on the green button Register New Device presented in the figure below.
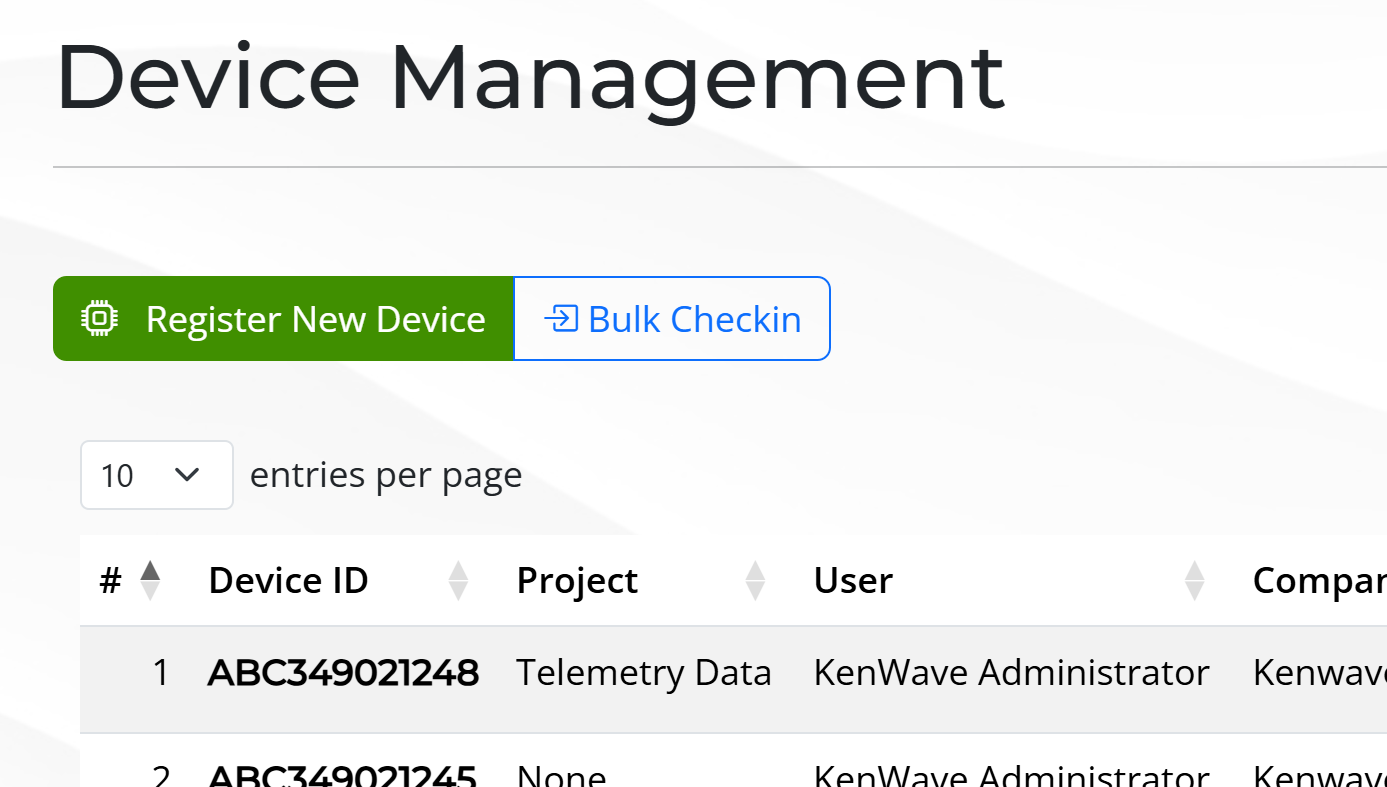
Then, follow the how to Register a New Device procedure link below. After that, the device will be registered in the Device Management list on the Devices page.
How To Register a New Device
For each device in the list, the following information is available:
Device ID
Assigned Project
Assigned User
Assigned Company
Current Version
IP Address
Last Online
Telemetry
Controls
The figure below displays a sample of information and Controls column’s buttons for some registered devices:
There are two action columns on the Device Management page:
Telemetry
Controls
The light blue View button on the Telemetry column drives the user to the Device Telemetry page. The other buttons, under the Control column enables different actions on the device.
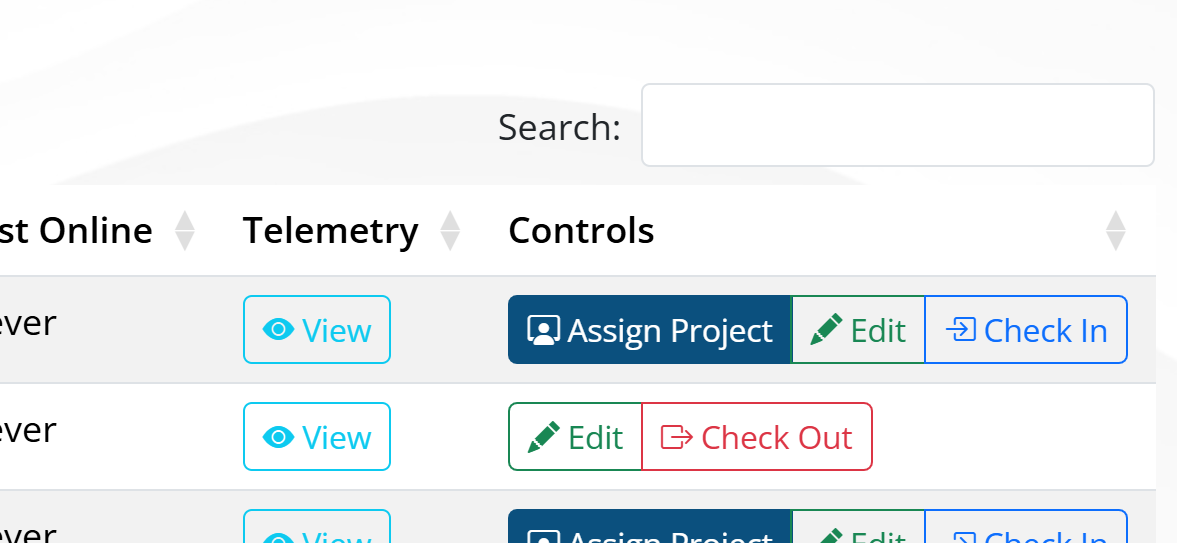
Click on the links below to see the action of each button:
The Check In and Check Out buttons are available only for devices that are not in use. The Check In button is enabled when the device is checked out, and the Check Out button is enabled when the device is checked in.
Management
The Management page shows information about projects on the DRI Analytics web application. It also allows project management on seven sections listed below:
General
Specifications
Managers
Files
Location
Timetables
Work Information
How to Create a New Project
To access the sections, a table containig a list of projects is displayed on the Projects panel, allowing the user to select them. The table contains the following information:
Created → the date of the project creation.
Number → the project’s number.
Name → the name of the project.
End Client → the end client of the project.
Also, the column Select displays a green button with an arrow for each project, which allows the user to select one project from the list. Once a project is selected, the Project’s Details panel will show the General tab with its general information. Clicking on a different tab’s title will show information for that specific category.
The figure below displays the Management page with the General tab selected for the New York City Water Pipes project.
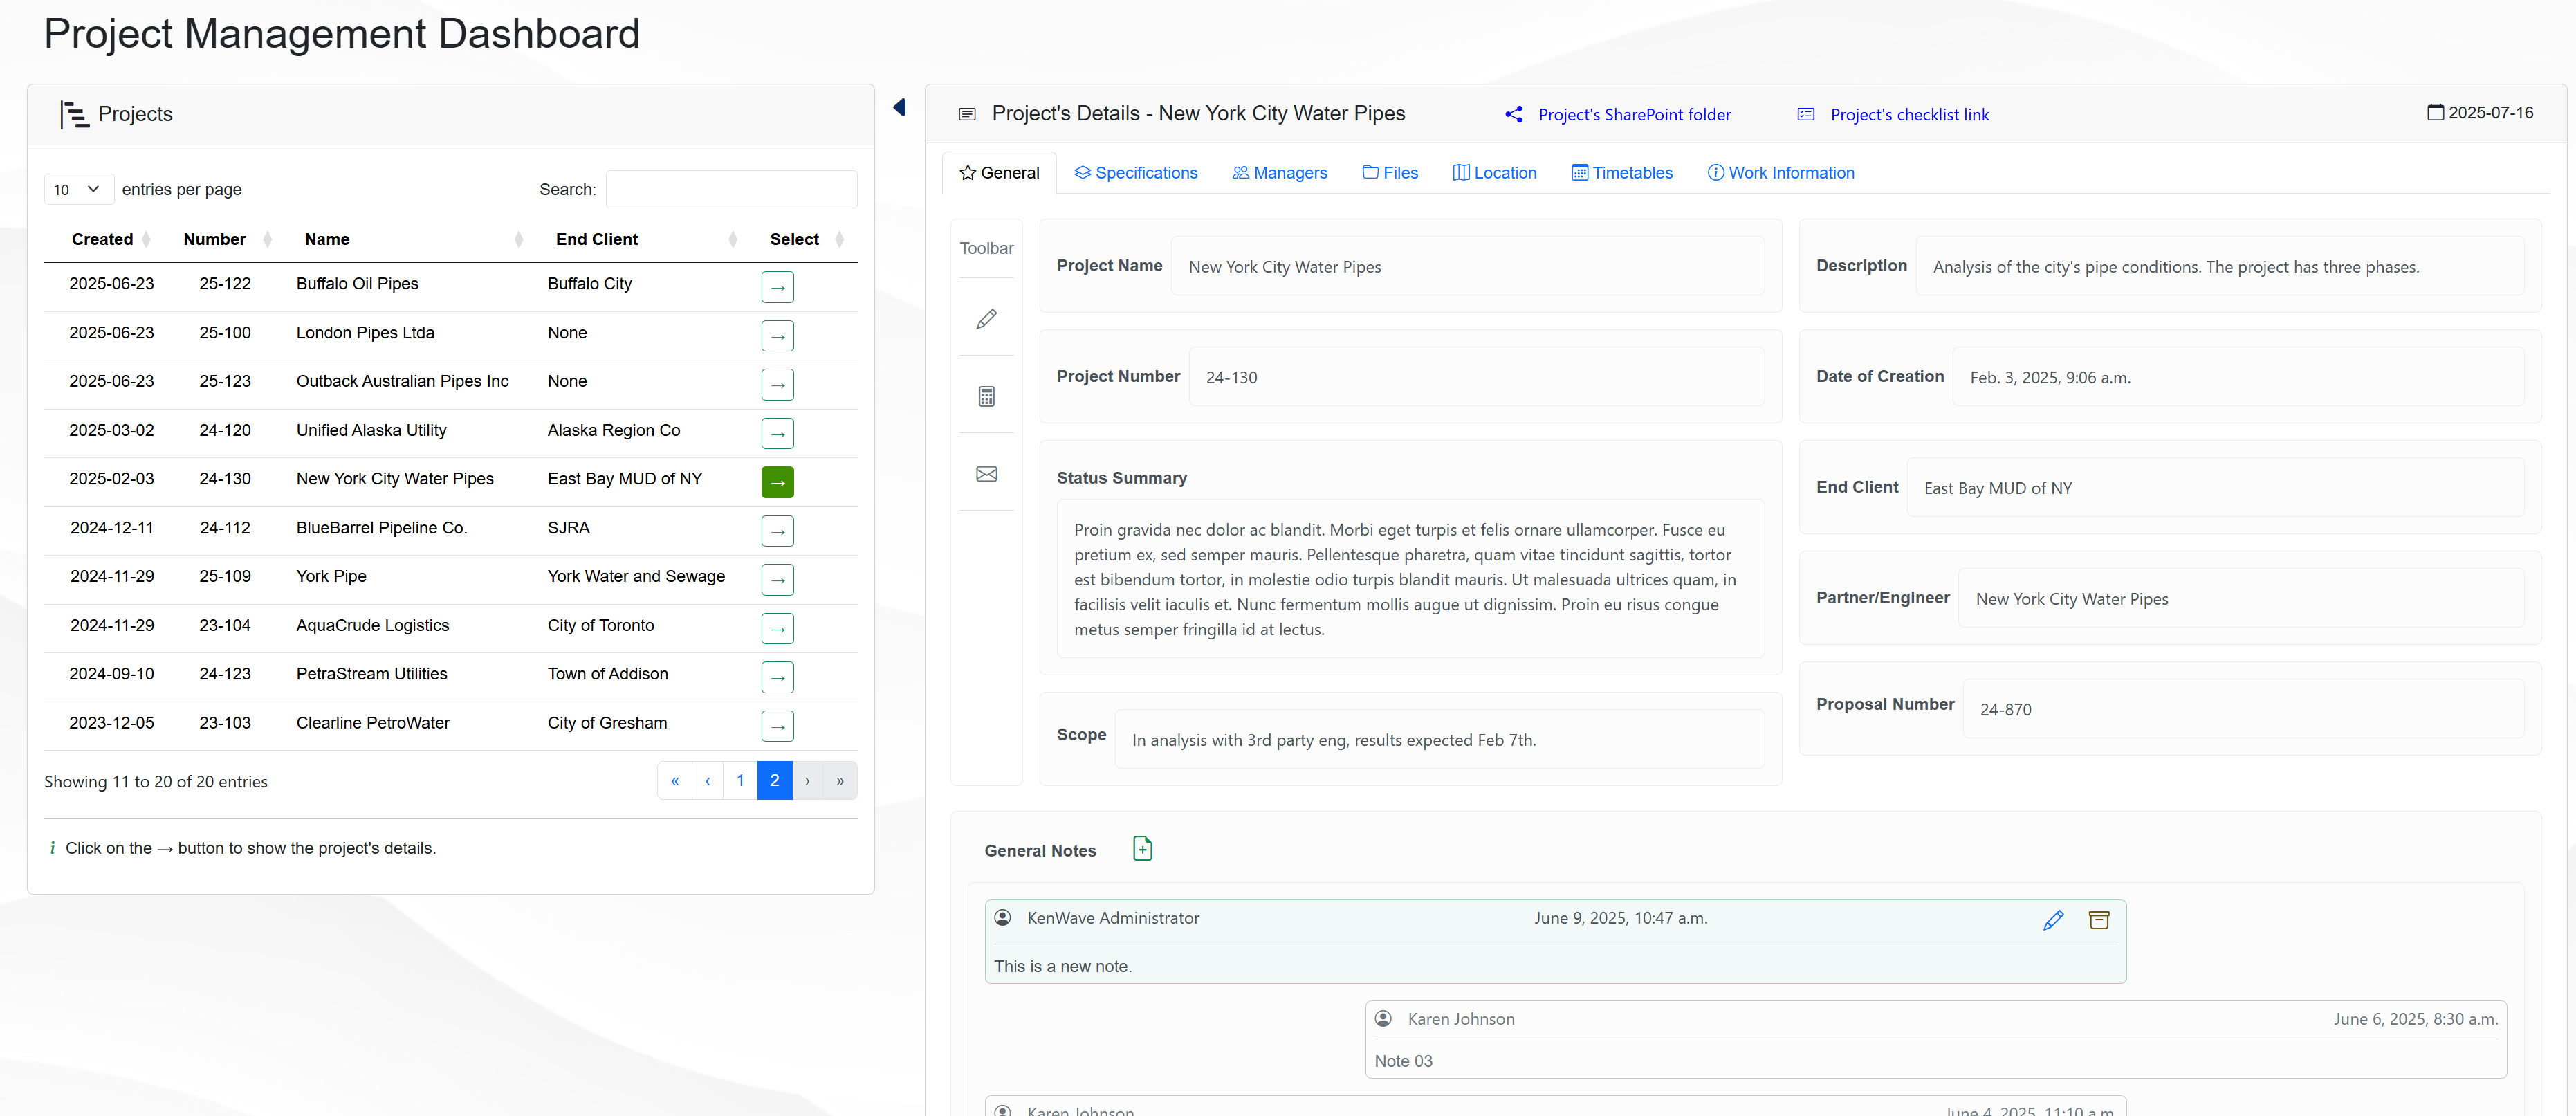
The Management page shows the following panels:
Projects → information about the projects registered in the DRI Analytics web application.
Project’s Details → information about the selected project, which is divided into seven sections.
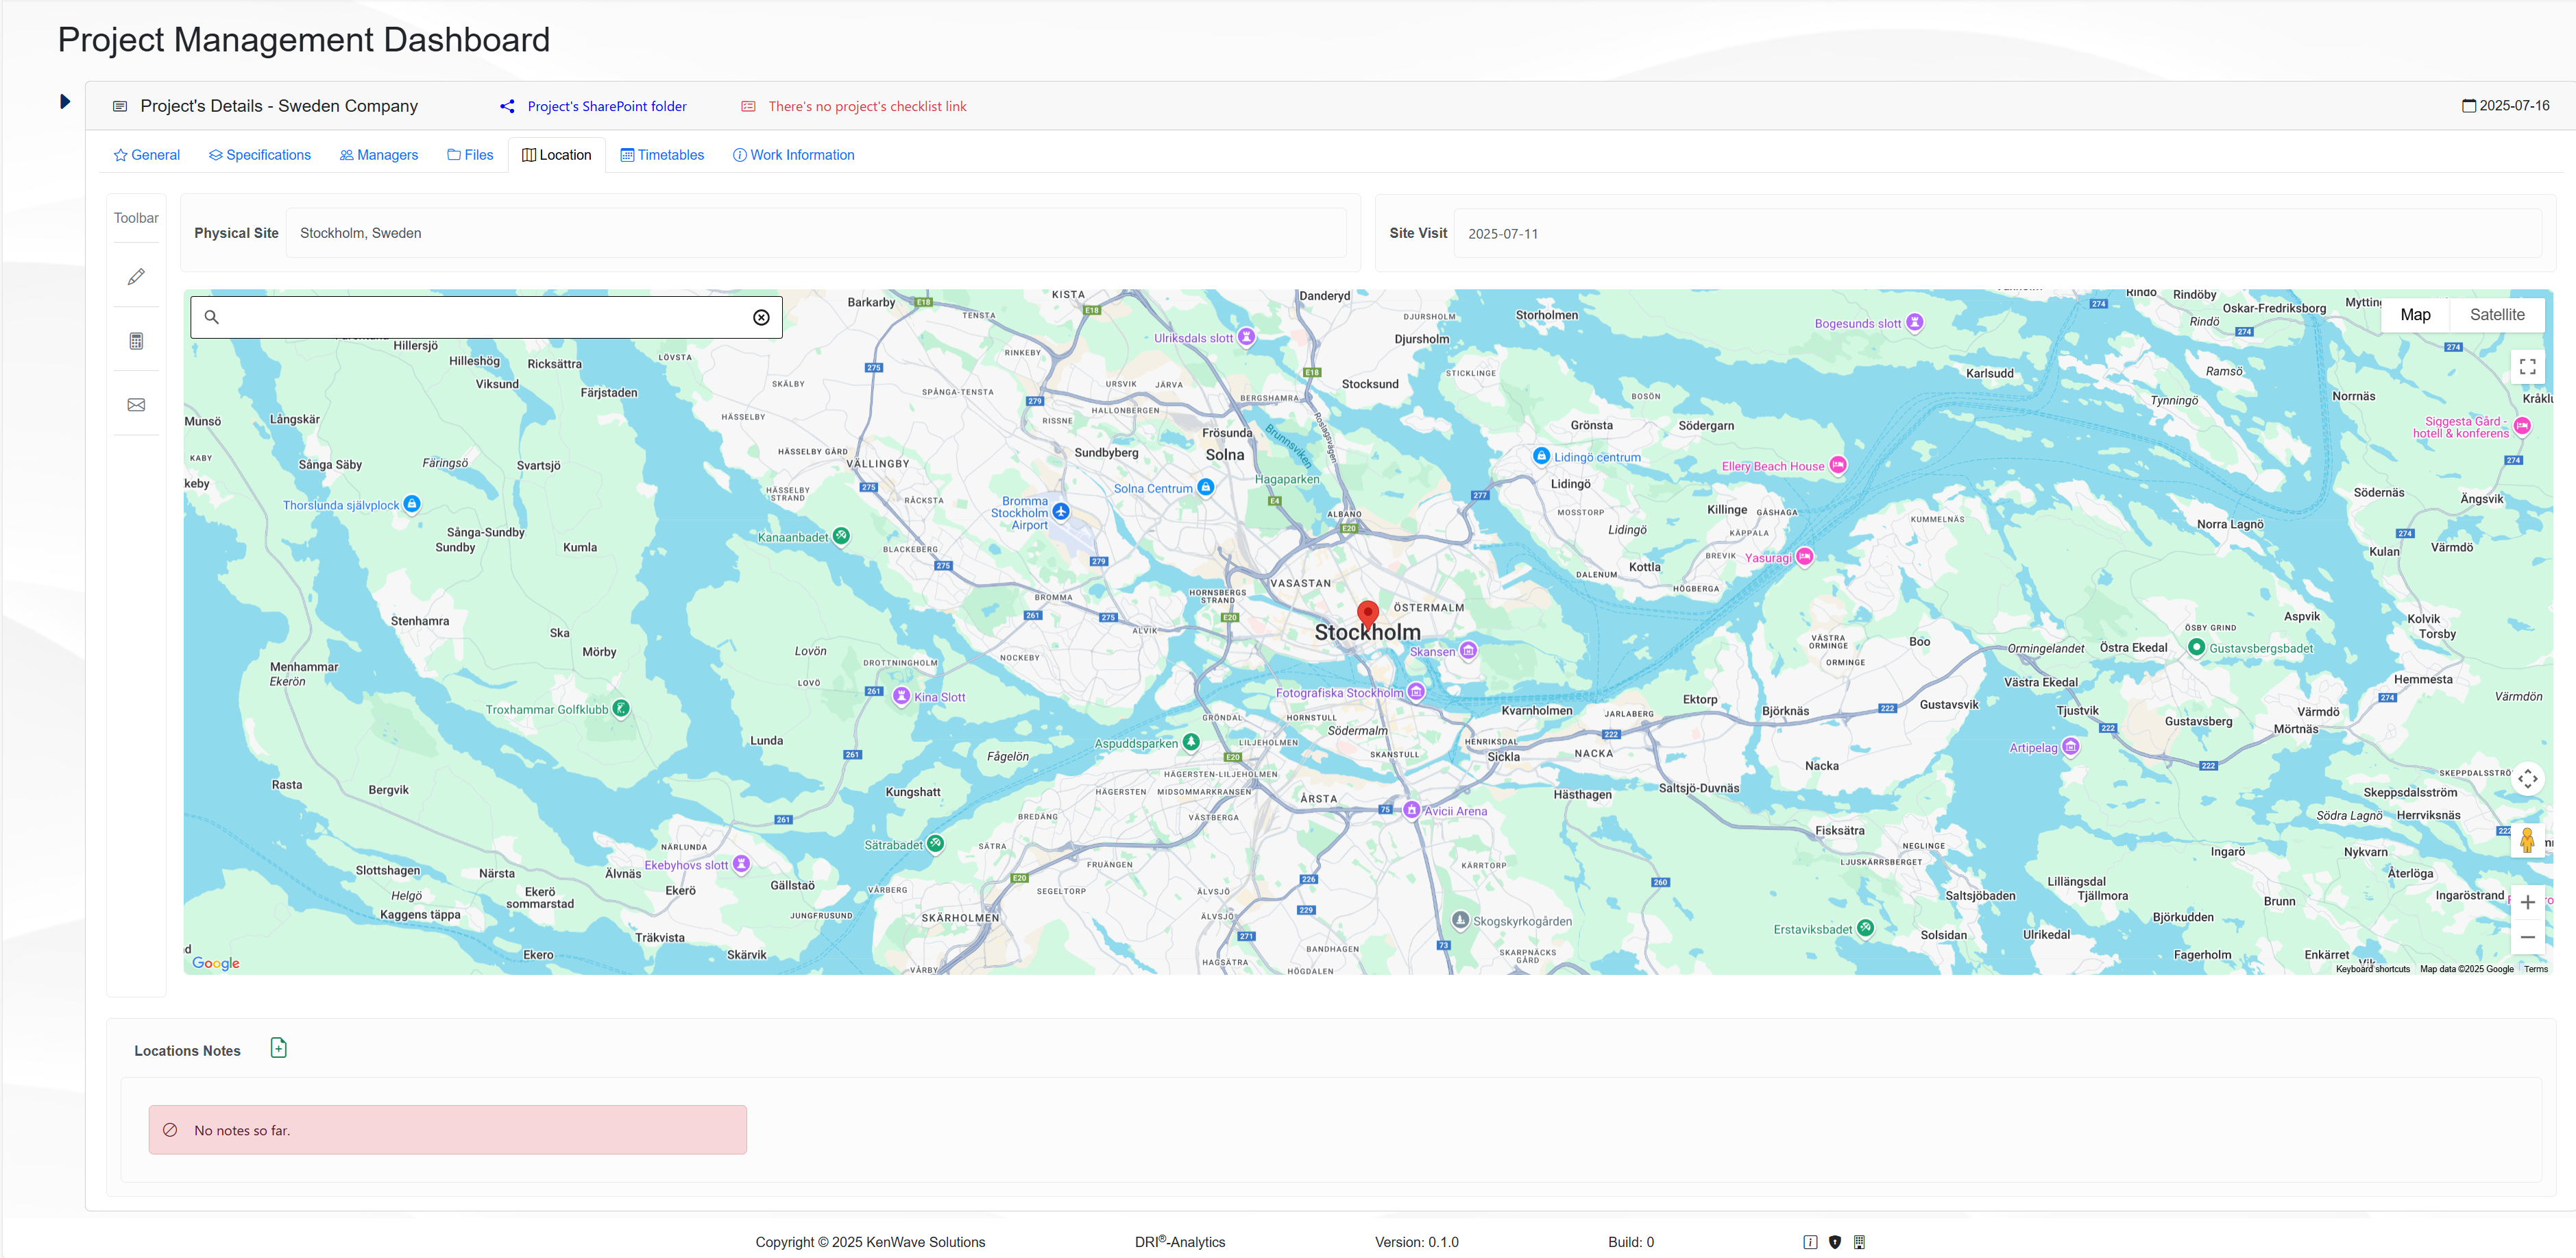
It’s possible to collapse and expand the Projects panel clicking on the triangle icon between the two panels. The figure below displays the collapse/expand icon.
When the collapse/expand icon is clicked, it toggles its state and allows the user to see a different view of the Project’s Details panel. The figure below shows the panel expanded when the Location tab is selected.
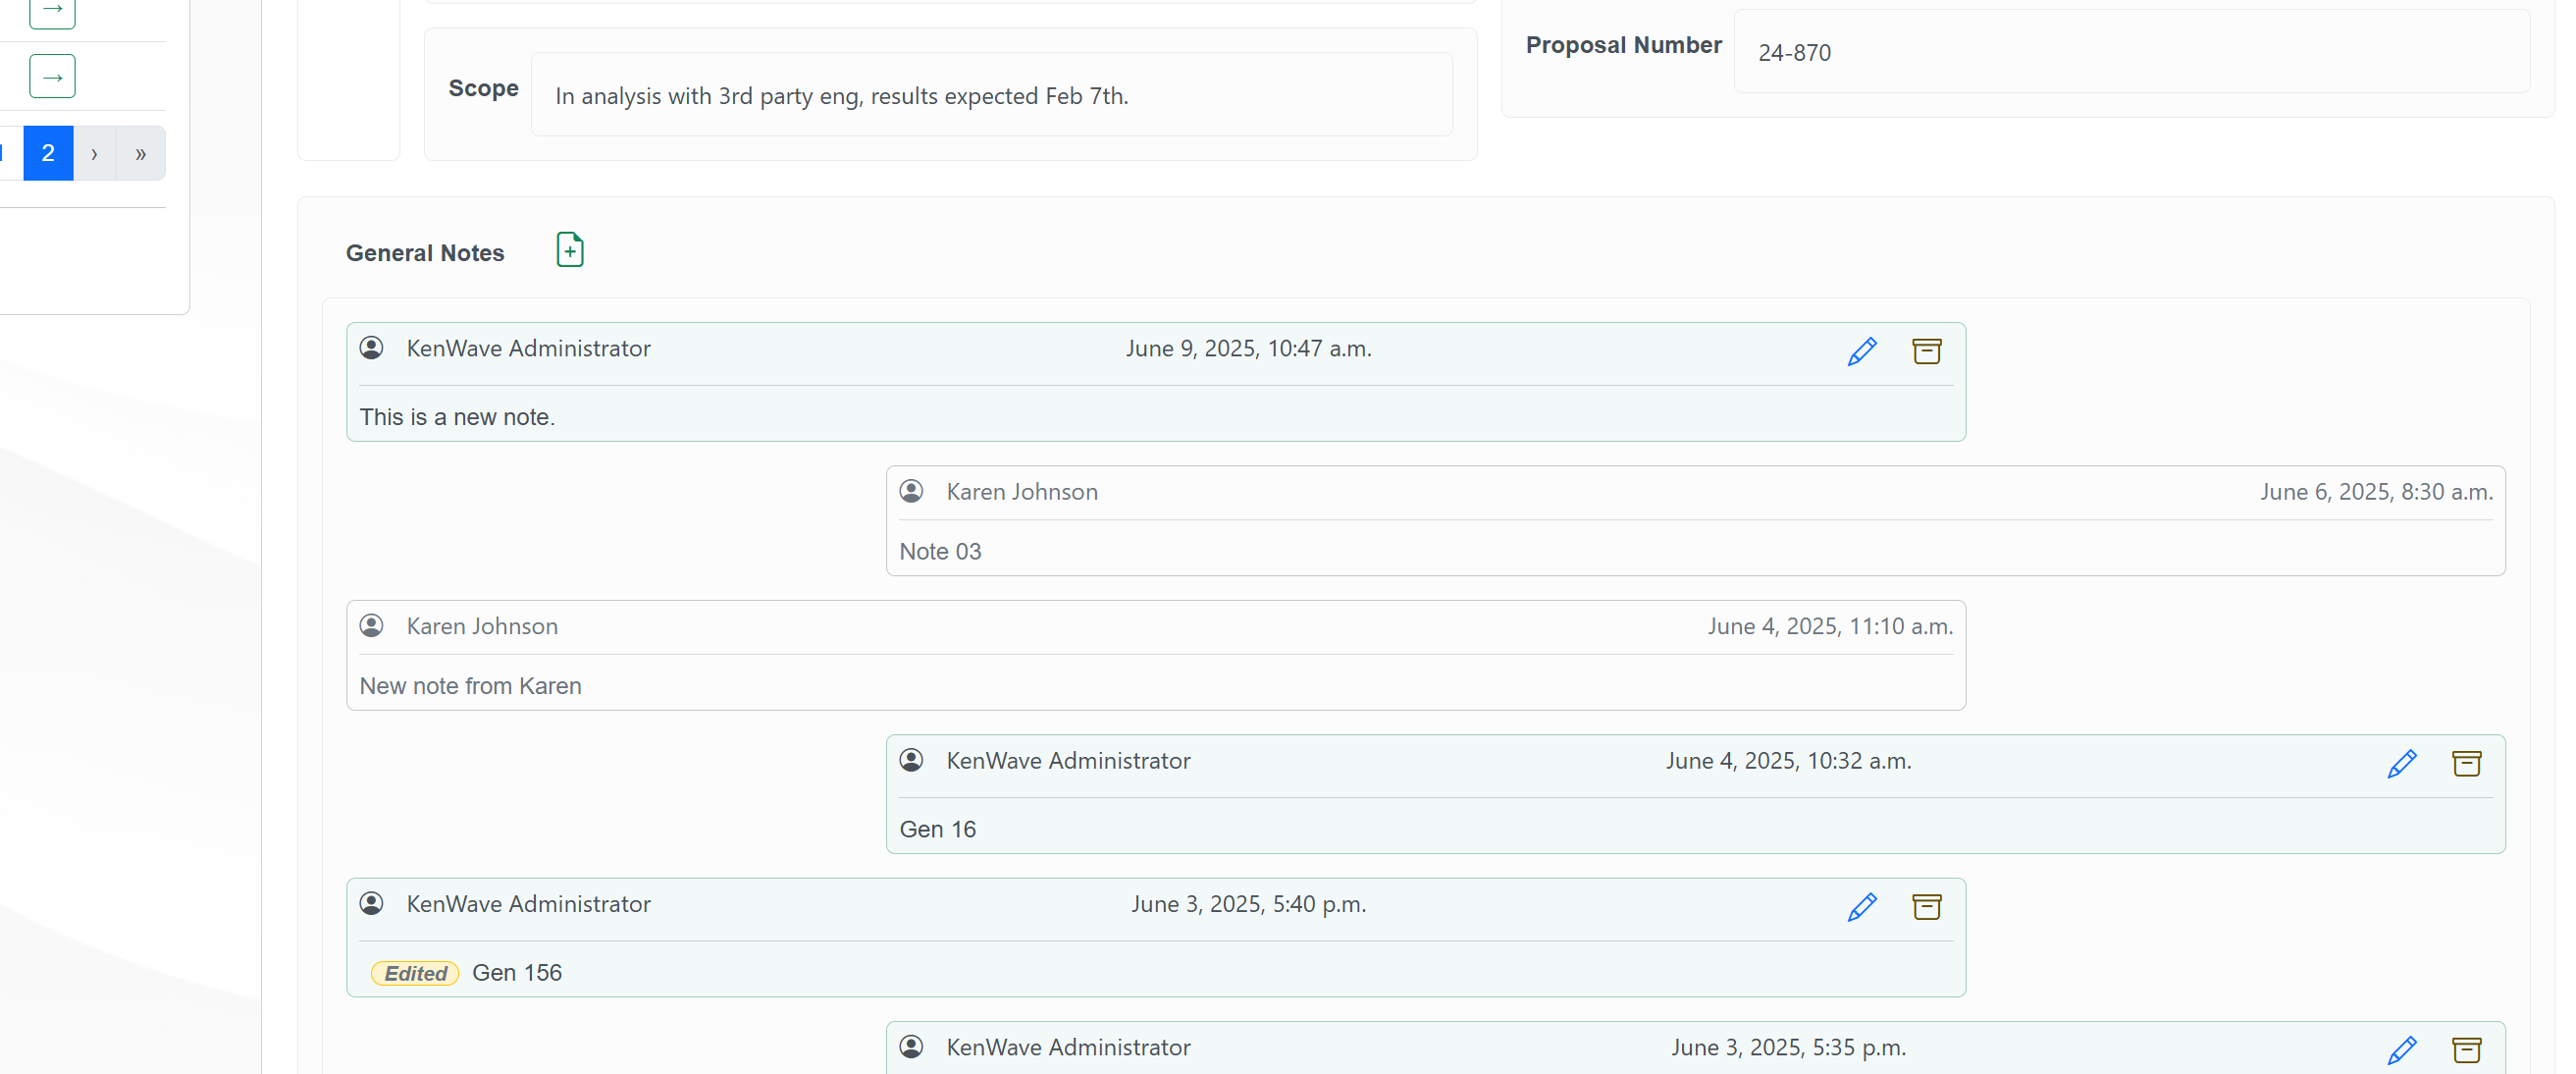
At the bottom of all tabs there’s the Notes section, which allows the user to add notes about the tab. It exists on all tabs, and the notes are specifics for each tab.
The figure below shows an example Notes section on the General tab.
To see the documentation of each section, click on the links below:
Analytics
The Analytics page shows information about the projects’ analytics on the DRI Analytics web application. It allows users to search information about the projects’ analytics on the following sections:
QAQC → Quality Assurance and Quality Control, which shows the status of all measurements from the project.
Project Overview → Shows a map and overall information for each site. The subtab shows a detailed information of the segments within each site, including a pipe segment layout.
Leak Detection → Summary of the detected leaks for each site and segment, including a schema that shows the position of the detected leaks.
Modal Analysis → Shows a cross section of the pipe besides the material properties. Present the eigenfrequency variation related to a variation in thickness.
Normalized Profiles → Present the results for Spectral Centroid, Mean, Coherence, Correlation Coefficient, and Resolution. Also allows the user to edit the weights for each measurement to be used on the weighted average calculation.
Frequency Analysis → Displays the Cross Spectral Density (CSD) and Coherence for each measurement along with modal energy and modal matching errors varying with thickness.
Summary → Shows the layout for the groups within the selected site besides a table containing the main information for each segment. The user can enter the thicknesses obtained on each different approach.
Scaled Profiles → Present the weighted average of the profile and allows the user to remove the slope, apply an offset, and a scaling factor. The graph is interactive, allowing to drag points.
Final Results → Present the final profile for each group within a site along with the resolution, nominal thickness and a detailed table including the data from the graph.
To access the sections, a table containig a list of projects is displayed on the Projects panel, allowing the user to select one of the projects. The table contains the following information:
Created → the date of the project creation.
Name → the name of the project.
End Client → the end client of the project.
Also, the column Select displays a green button with an arrow for each project, which allows the user to select one project from the list. Once a project is selected, the Project’s Details panel will show the QAQC tab with the project’s Quality Assurance and Quality Control information. Clicking on a different tab, will show information for that specific category.
The figure below displays the Analytics page with the QAQC tab selected for the New York City Water Pipes project.