Project Overview
The Project Overview tab on the Analytics page allows the user to set general information about the project analysis and its sites and groups.
The figure below displays the Analytics page with the Project Overview tab selected for the 2509-RJNArvada project. The red rectangle highlights the Project Overview tab.
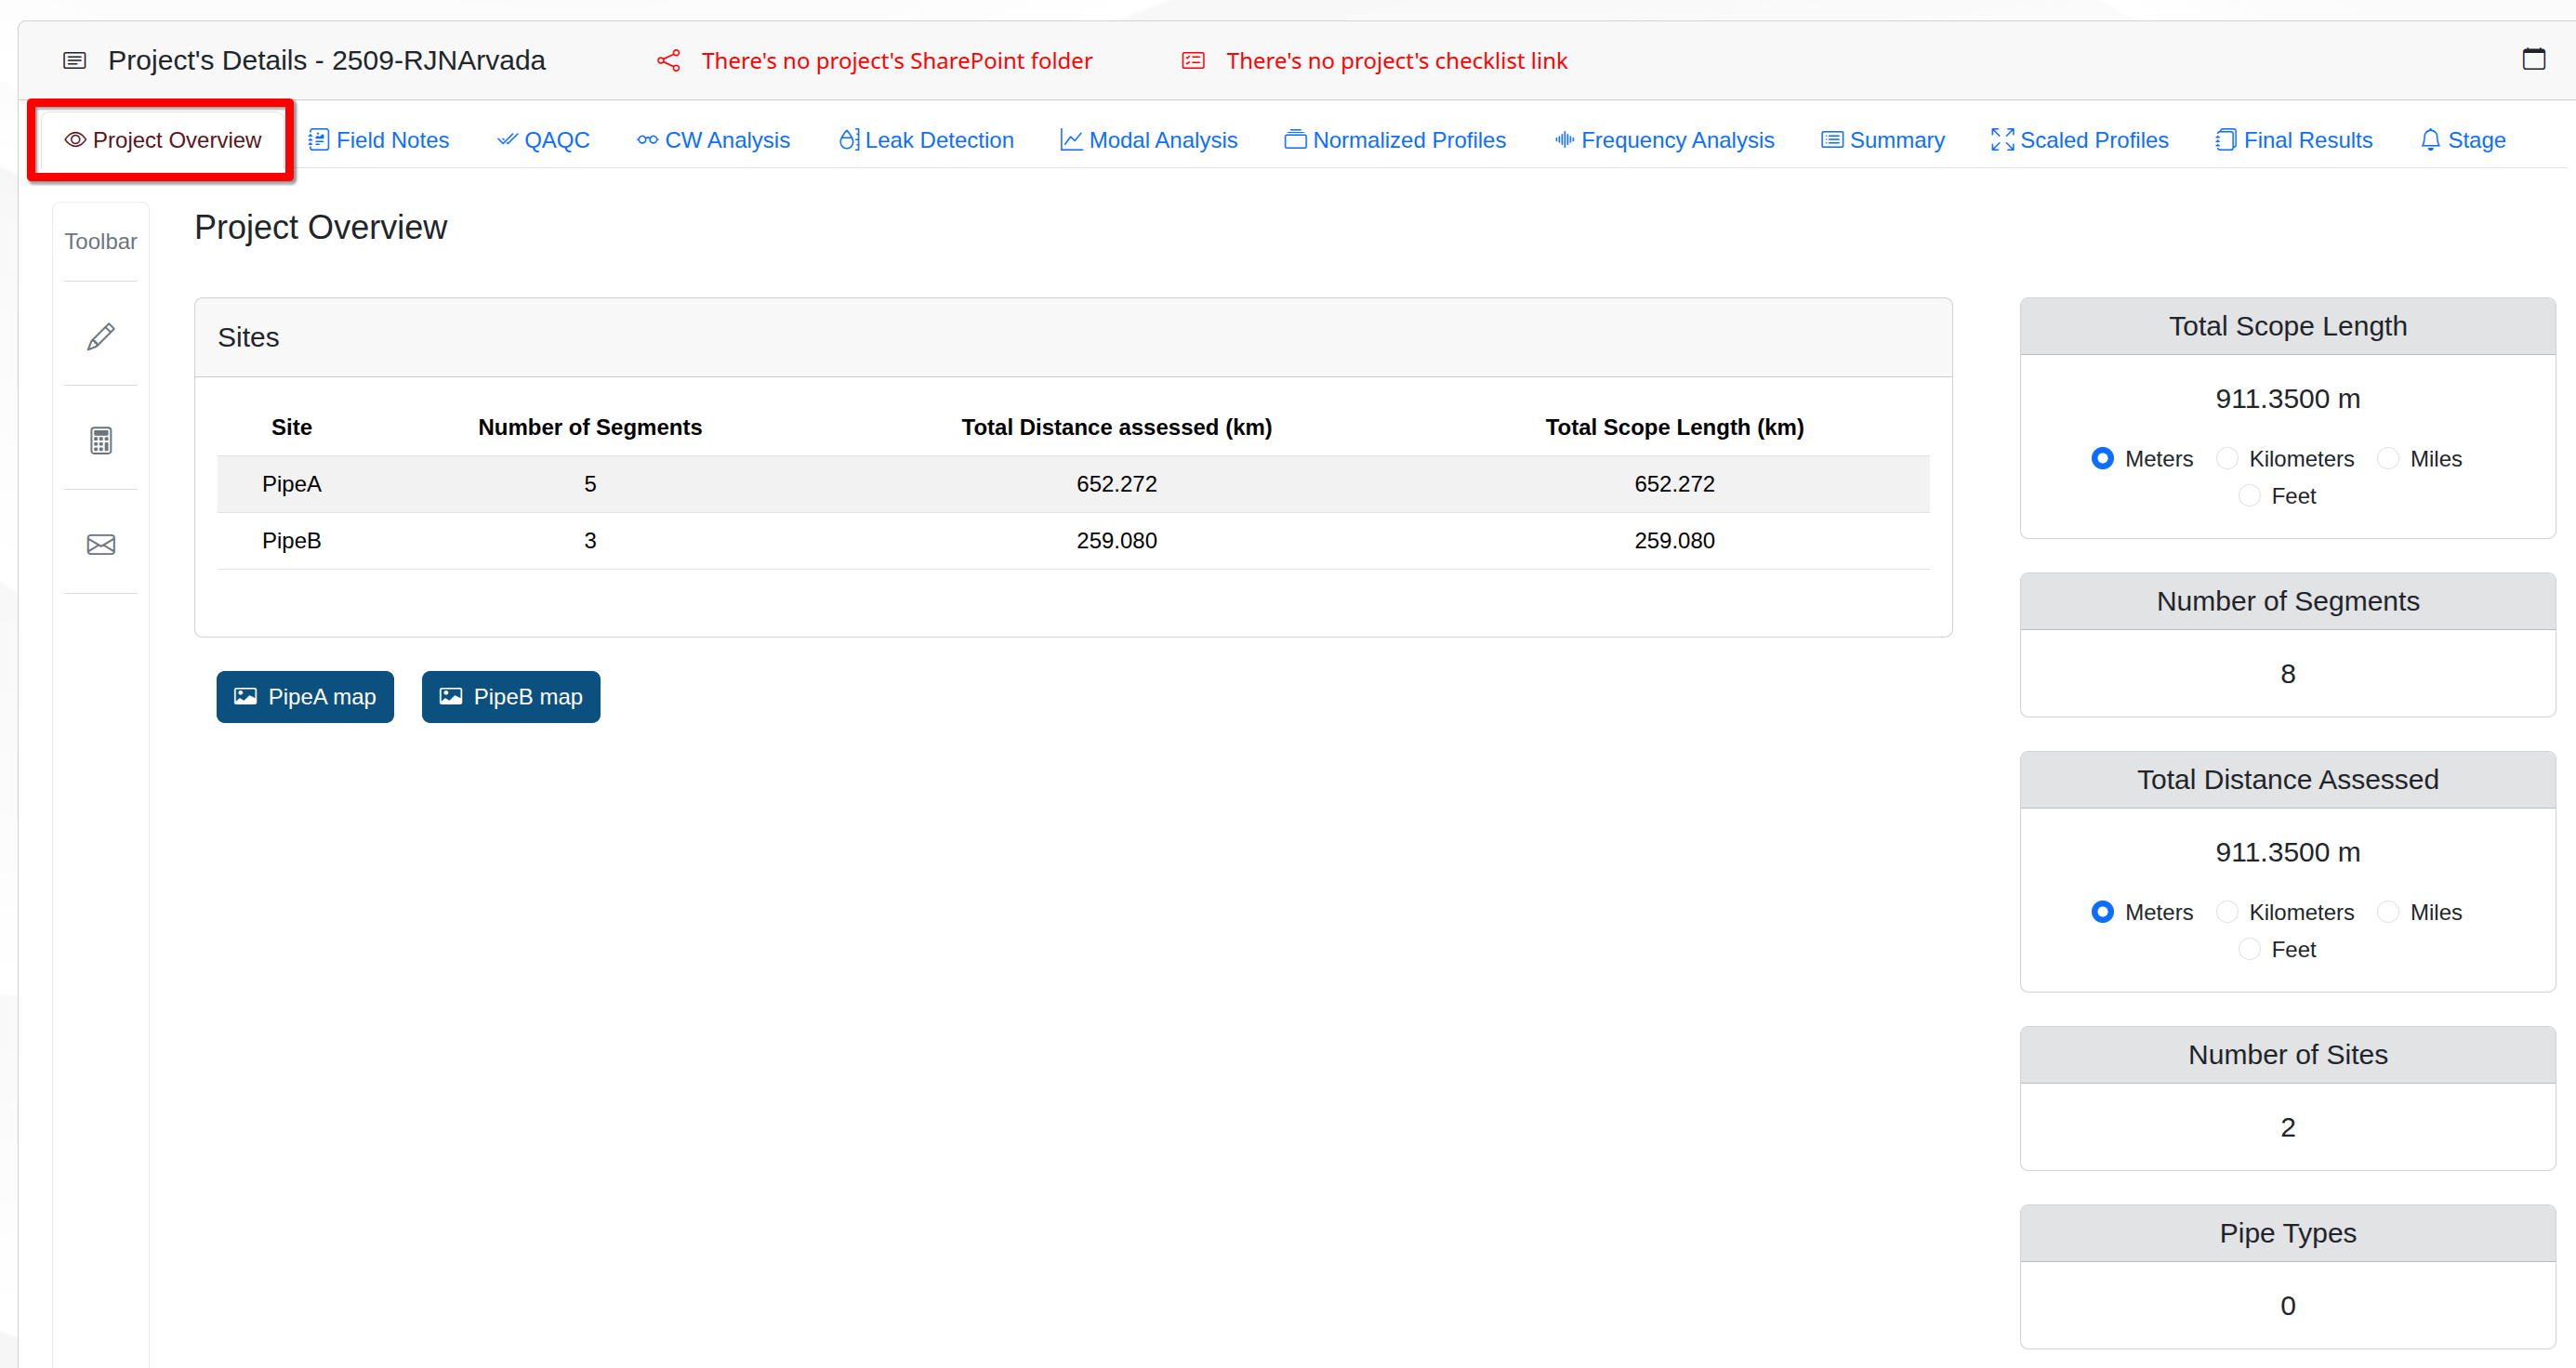
The Project Overview tab contains the following elements:
Sites panel → List of the projects sites with information for their name, Number of Segments, Total Distance Assesed (Km), and Total Scope Length (Km) in the table Sites.
Site maps list of buttons → A list of buttons for each site in the project to show their map images and other information.
Right Cards → Five cards with consolidated project’s information.
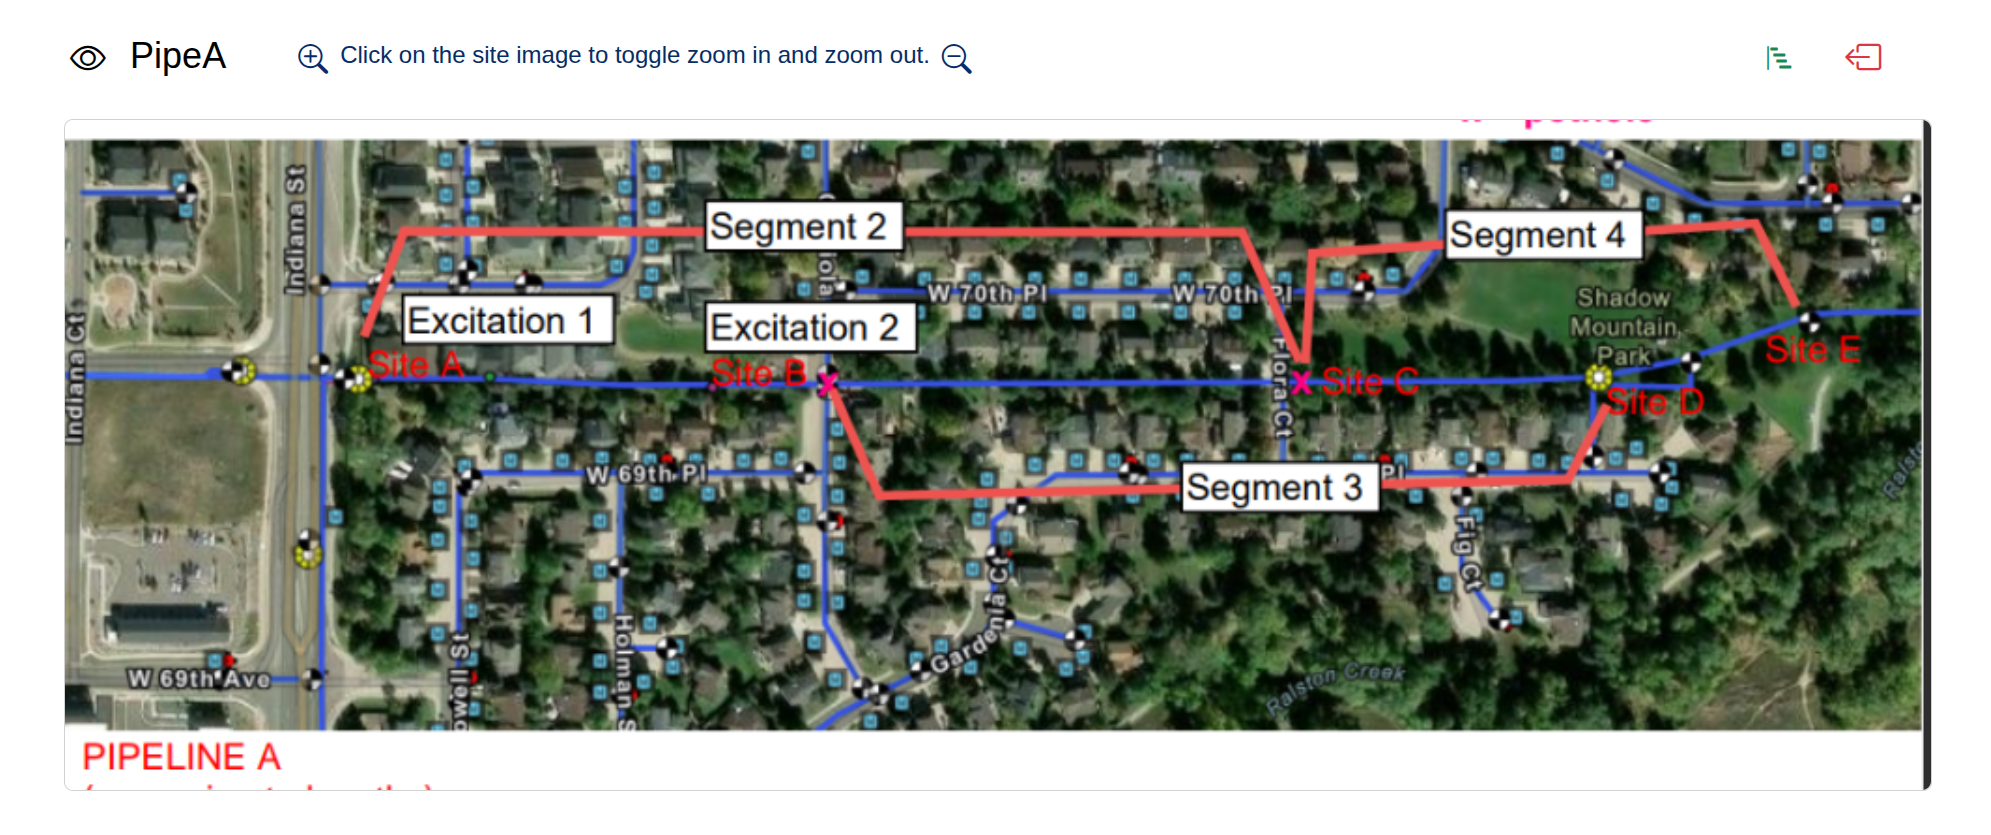
Site Map
After clicking on a site’s map button, the site map image are displayed in the tab and will allow the following options:
- Map thumbnail → A clickable thumbnail of the site's map image.
- View Project Scope, Segment Layout, and Pipe Specification Summary panels → The green view icon allows the user to open the three panels with more detailed information about the current project.
- Return to the list of sites → The red return icon allows the user to return to the list of sites when clicked, closing the three detail tables opened by the view icon.
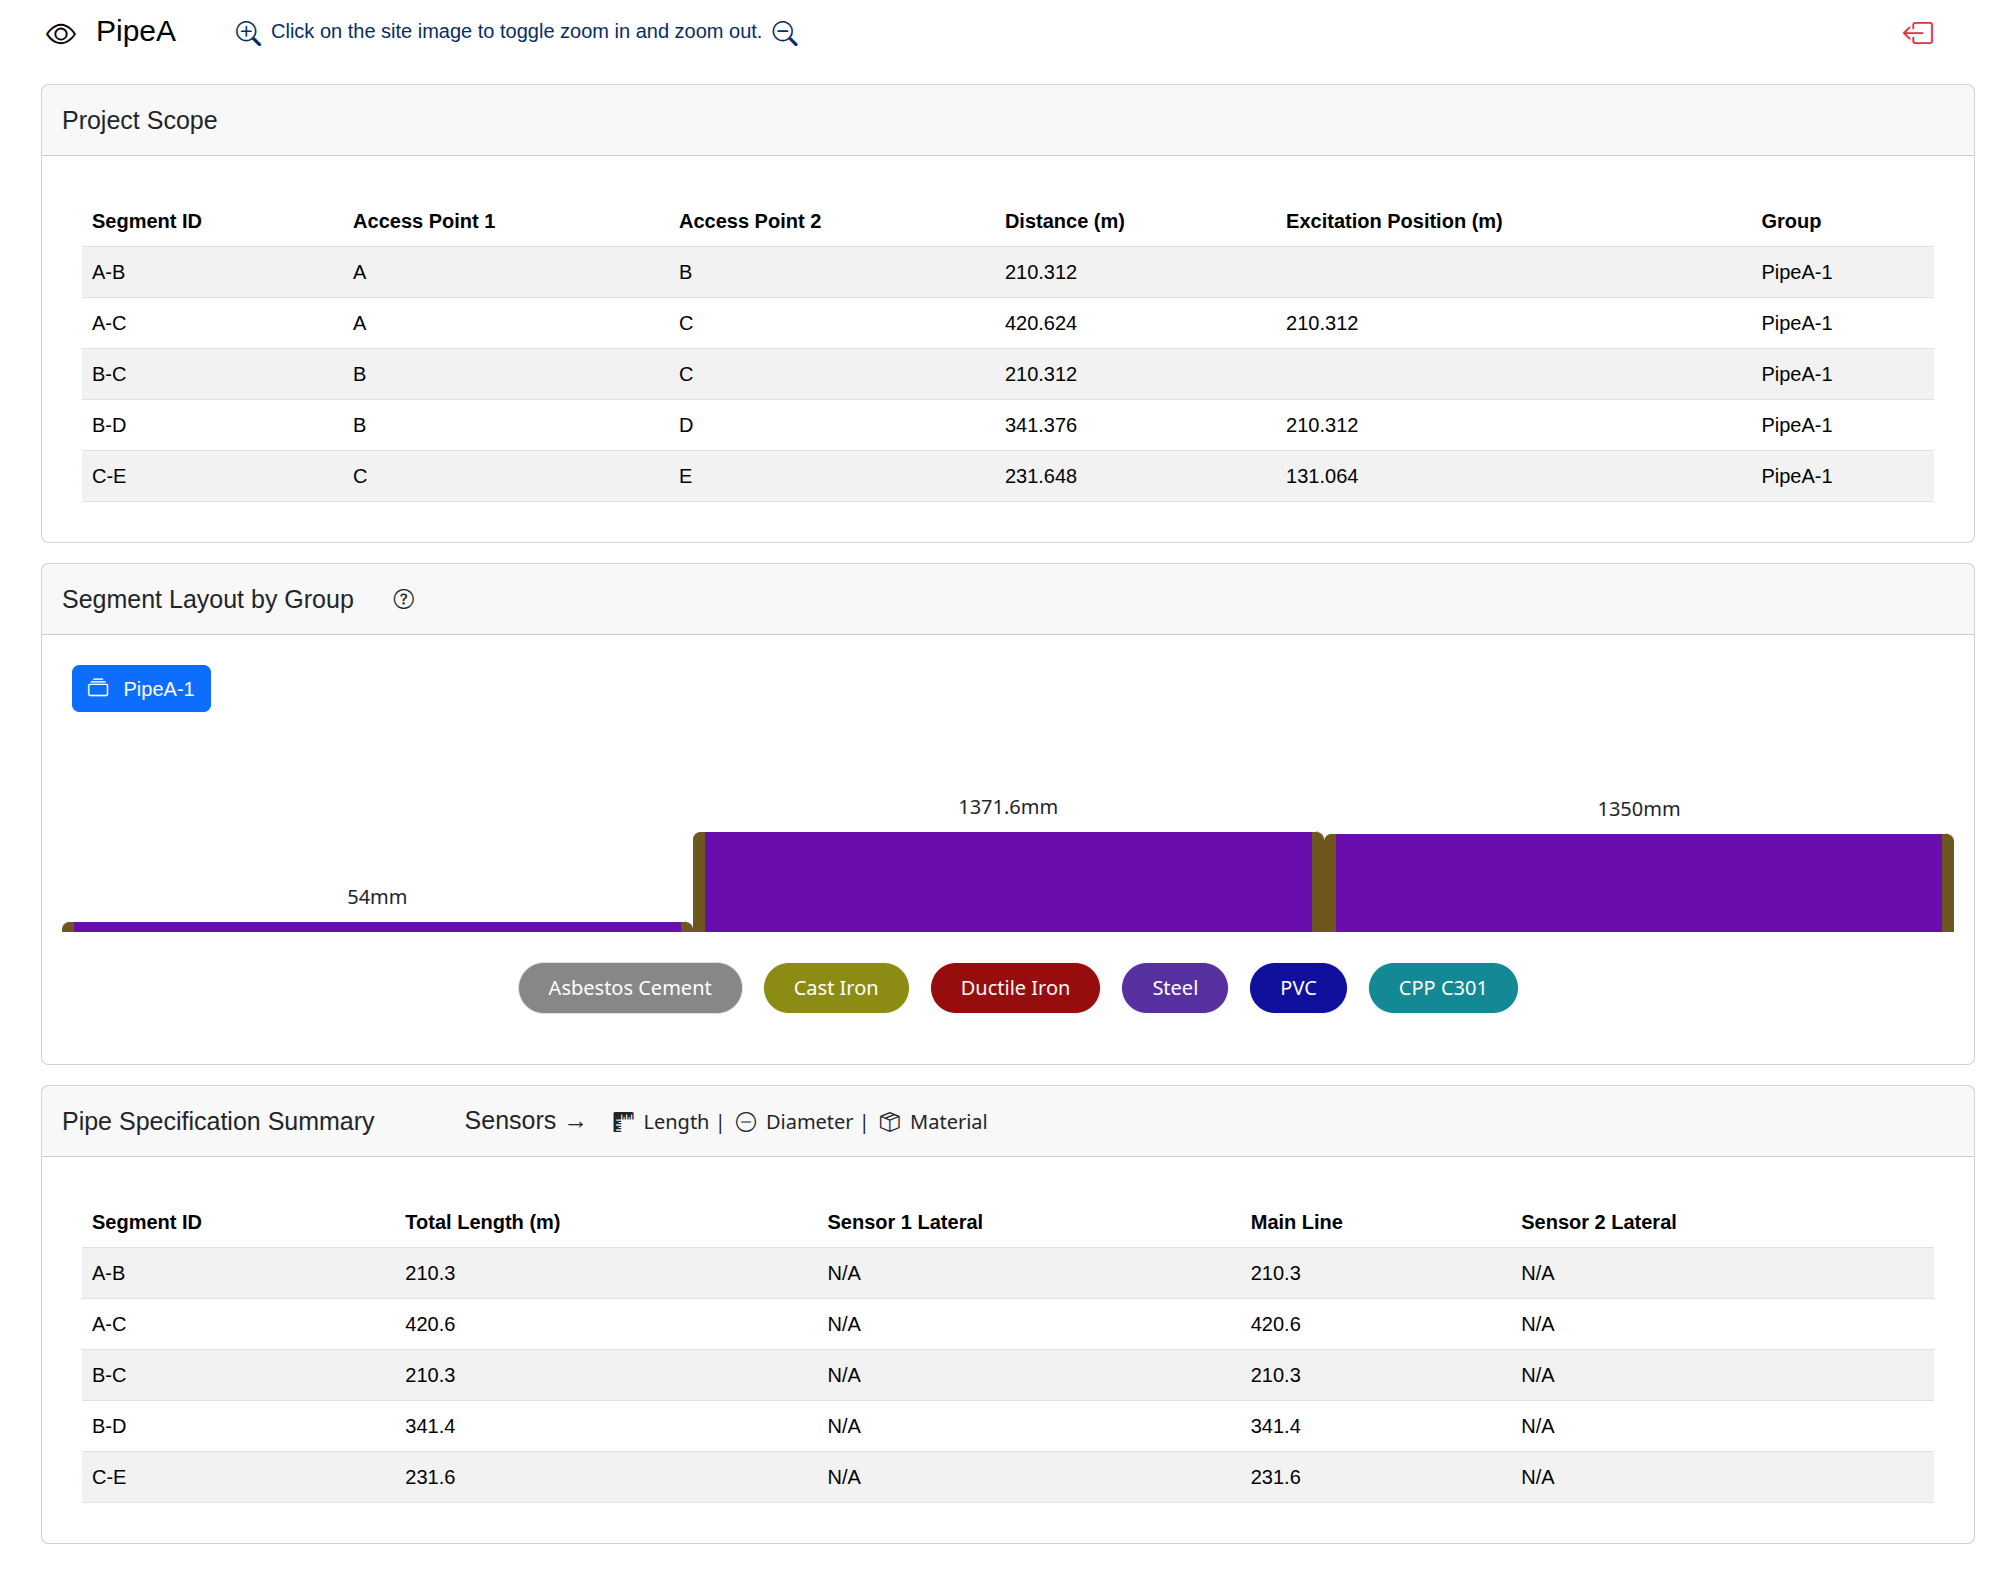
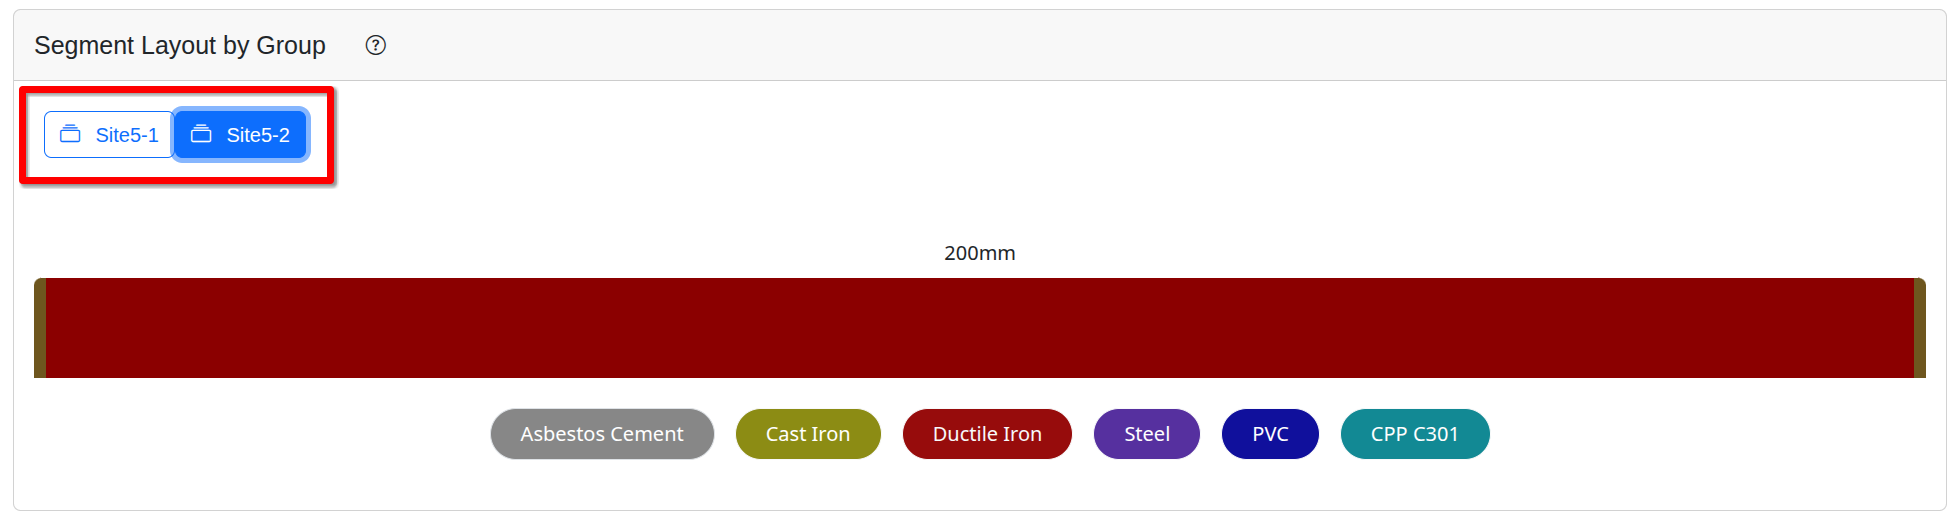
In the case of the panel Segment Layout by Group, the user can select another group to show the segment layout for that group. The figure below shows the segment layout for the group PipeA-1. In the figure below, another project shows the segment layout for more than one group.
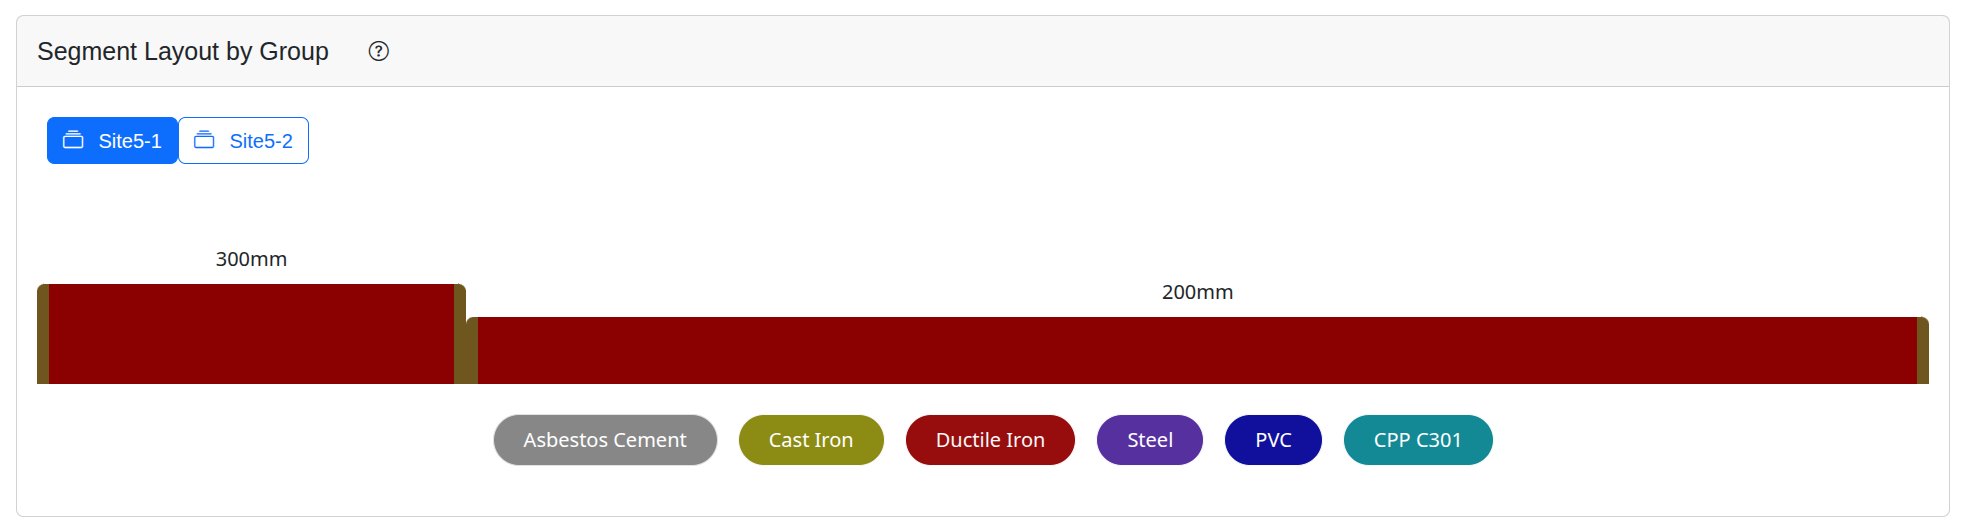
Clicking on the second button change the graph to show its segment layout. The figure below shows the segment layout for the group Site5-2.
The Project Scope panel shows the project’s scope information, including access points, the distance between them, the excitation position, and the group they belong to.
The Pipe Specification Summary panel provides a summary of the segment_id, total length in meters, sensor 1 lateral, main line, and sensor 2 lateral.