Stage
The Stage tab on the Analytics page allows users to review changes to the following project elements:
Sites
Groups
Access Points
Measurements
Pipe Specifications
Page sections:
The figure below shows the Stage tab with sample changes. The red outline highlights the Stage tab.
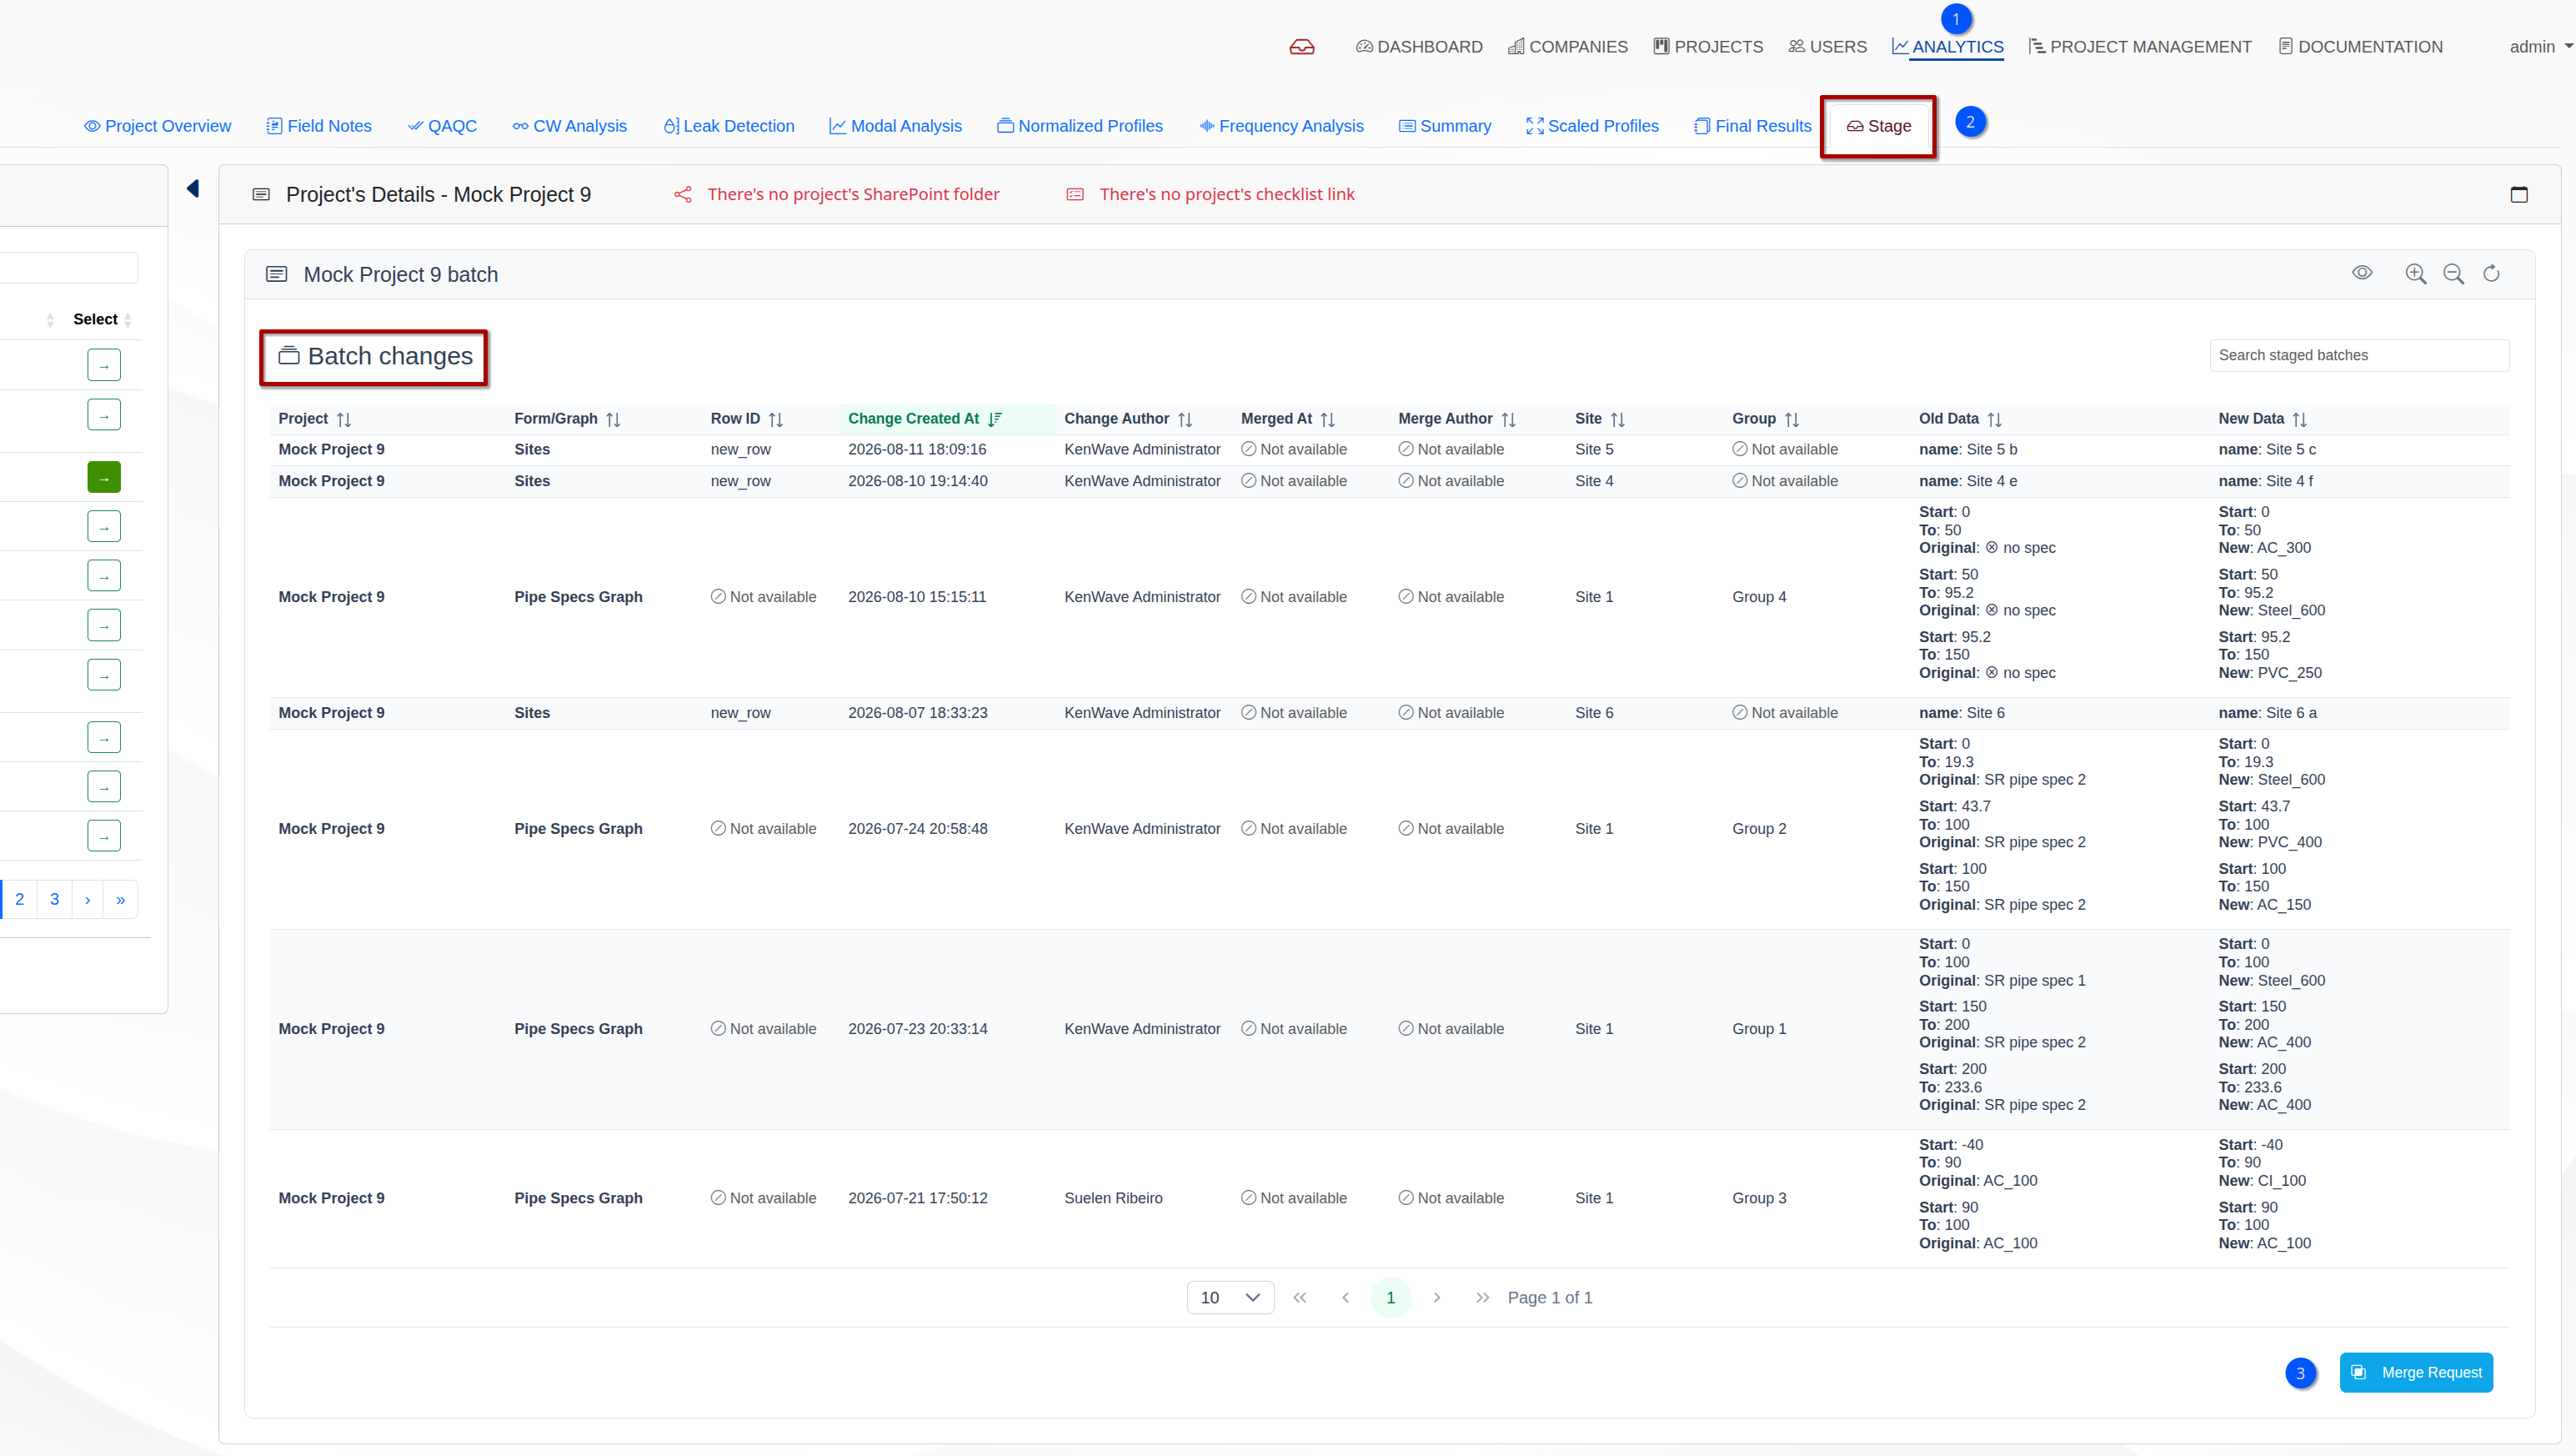
The main element of the Stage tab is the Batch Changes table, which has 11 columns:
Project - the project name.
Form/Graph - the form or graph where the change occurred. For example, changes can come from the Sites, Groups, or Measurements forms, or from the Access Points or Pipe Specifications graph.
Row ID - the identifier of the changed row, or the
new_rowstring if the row was newly created.Change Created At - the date and time when the change was created.
Change Author - the user who created the change.
Merged At - the date and time when the change was merged, if available.
Merge Author - the user who merged the change, if available.
Site - the site affected by the change.
Group - the group affected by the change, when available.
Old Data - the previous value or values before the change.
New Data - the updated value or values after the change.
Batch Changes Table Controls
The Batch Changes table has four action icons in the top-right corner of its card:
| Show or hide previous changes for each batch entry. By default, only the latest changes for each element are shown in the table. | |
| Zoom in on the table's cells to improve readability on small screens. | |
| Zoom out the table cells to improve readability on large screens. | |
| Reset the zoom level to the default value. |
The figure below shows the Batch Changes table action icons:

Stage Workflow
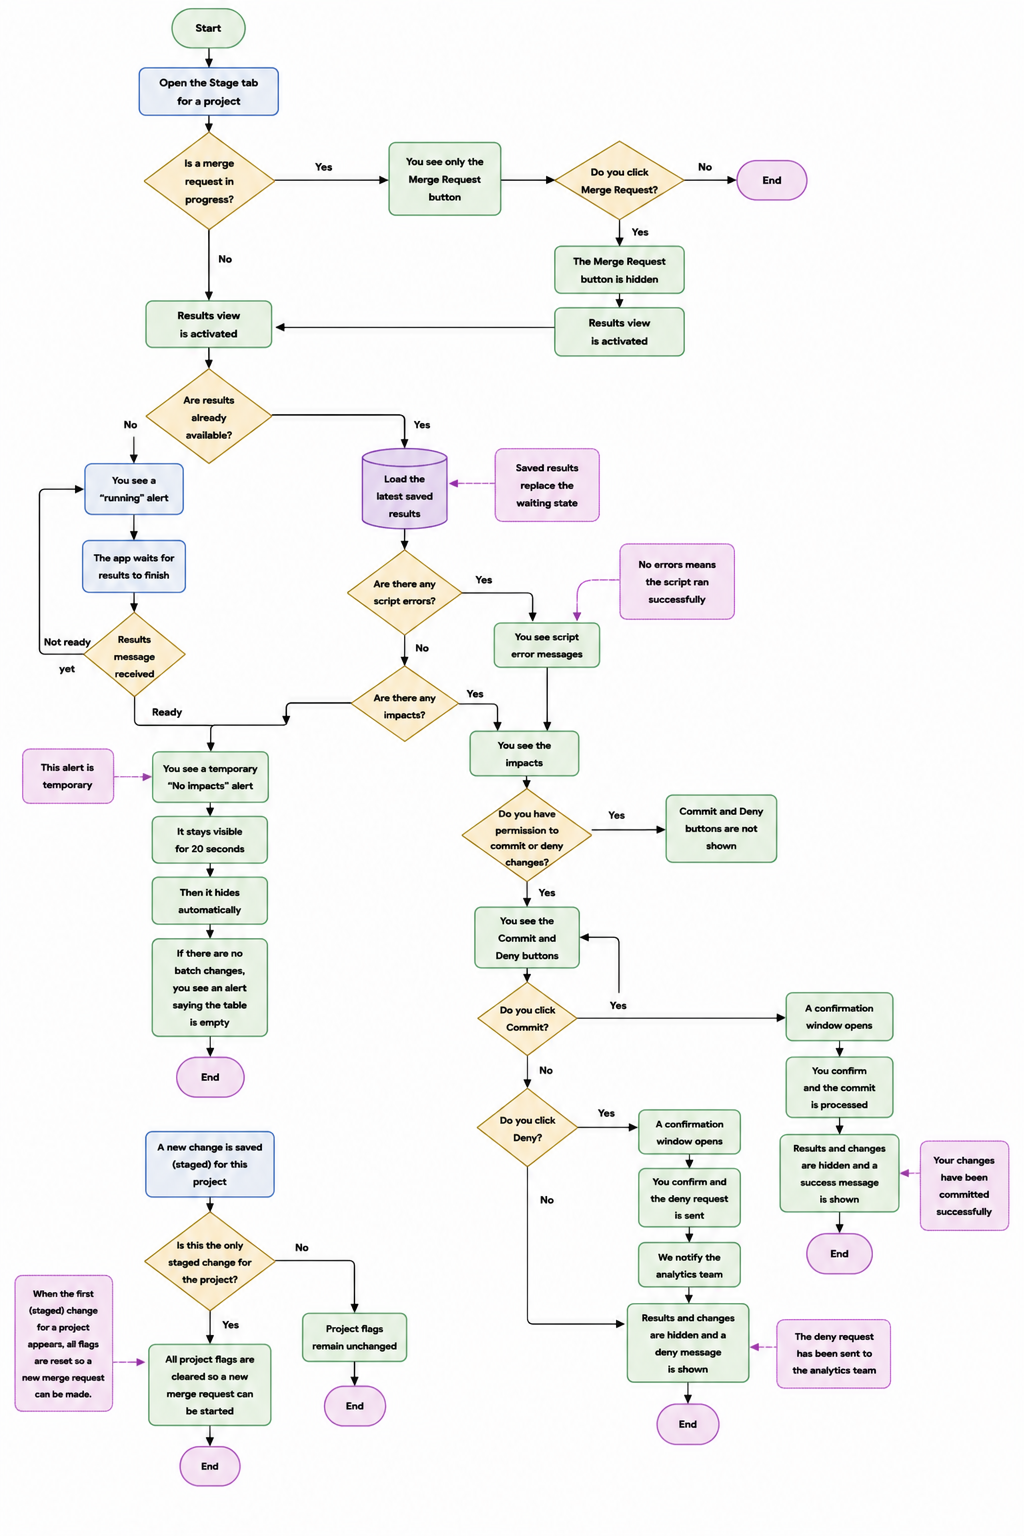
The workflow graph below shows the Stage lifecycle:
- Project batch changes are shown on the Stage tab.
- button is clicked.
- The analytics script runs.
- Batch results are shown, with or without impacts, or
- Analytics backend script errors are shown.
- button is clicked, or
- button is clicked.
Stage State Alert Icon
When you open the DRI-Platform web app, you can check whether there are changes on the Stage tab without opening the tab itself. The stage state icon, located to the left of the navbar, lets you check this from any page on the site.
The figure below shows the stage state icon in its active state.

The stage state icon has two states:
| There are changes in one or more project batches, so a Merge Request action is required. | |
| All project batches are empty, so no action is required. |
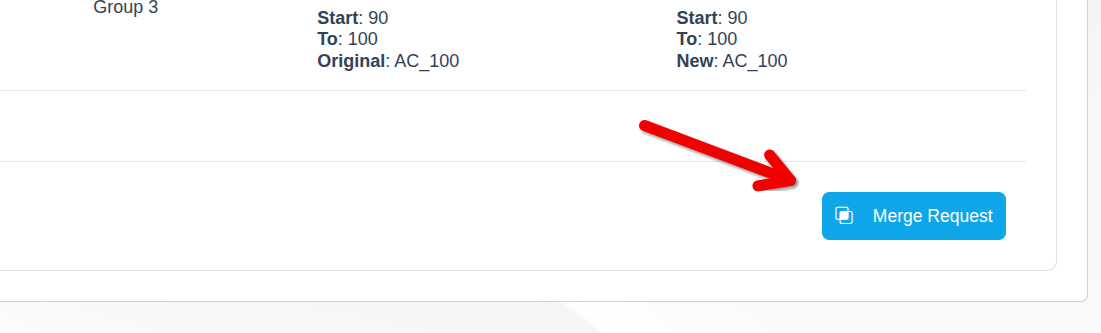
Merge Request
The figure below shows the button on the Stage tab.
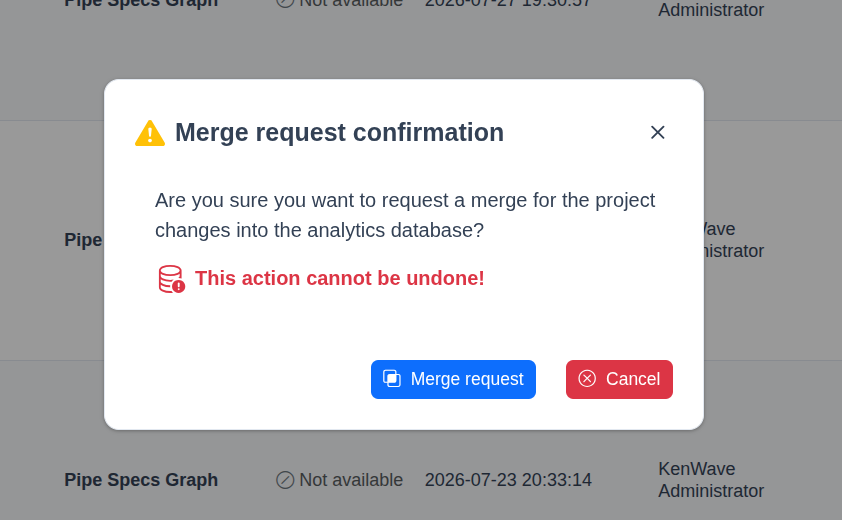
When the user clicks the button, a confirmation modal window appears, allowing the user to confirm or deny the action. The figure below shows the confirmation window.
After confirmation, an alert displays two messages:
the batch changes were sent to the backend.
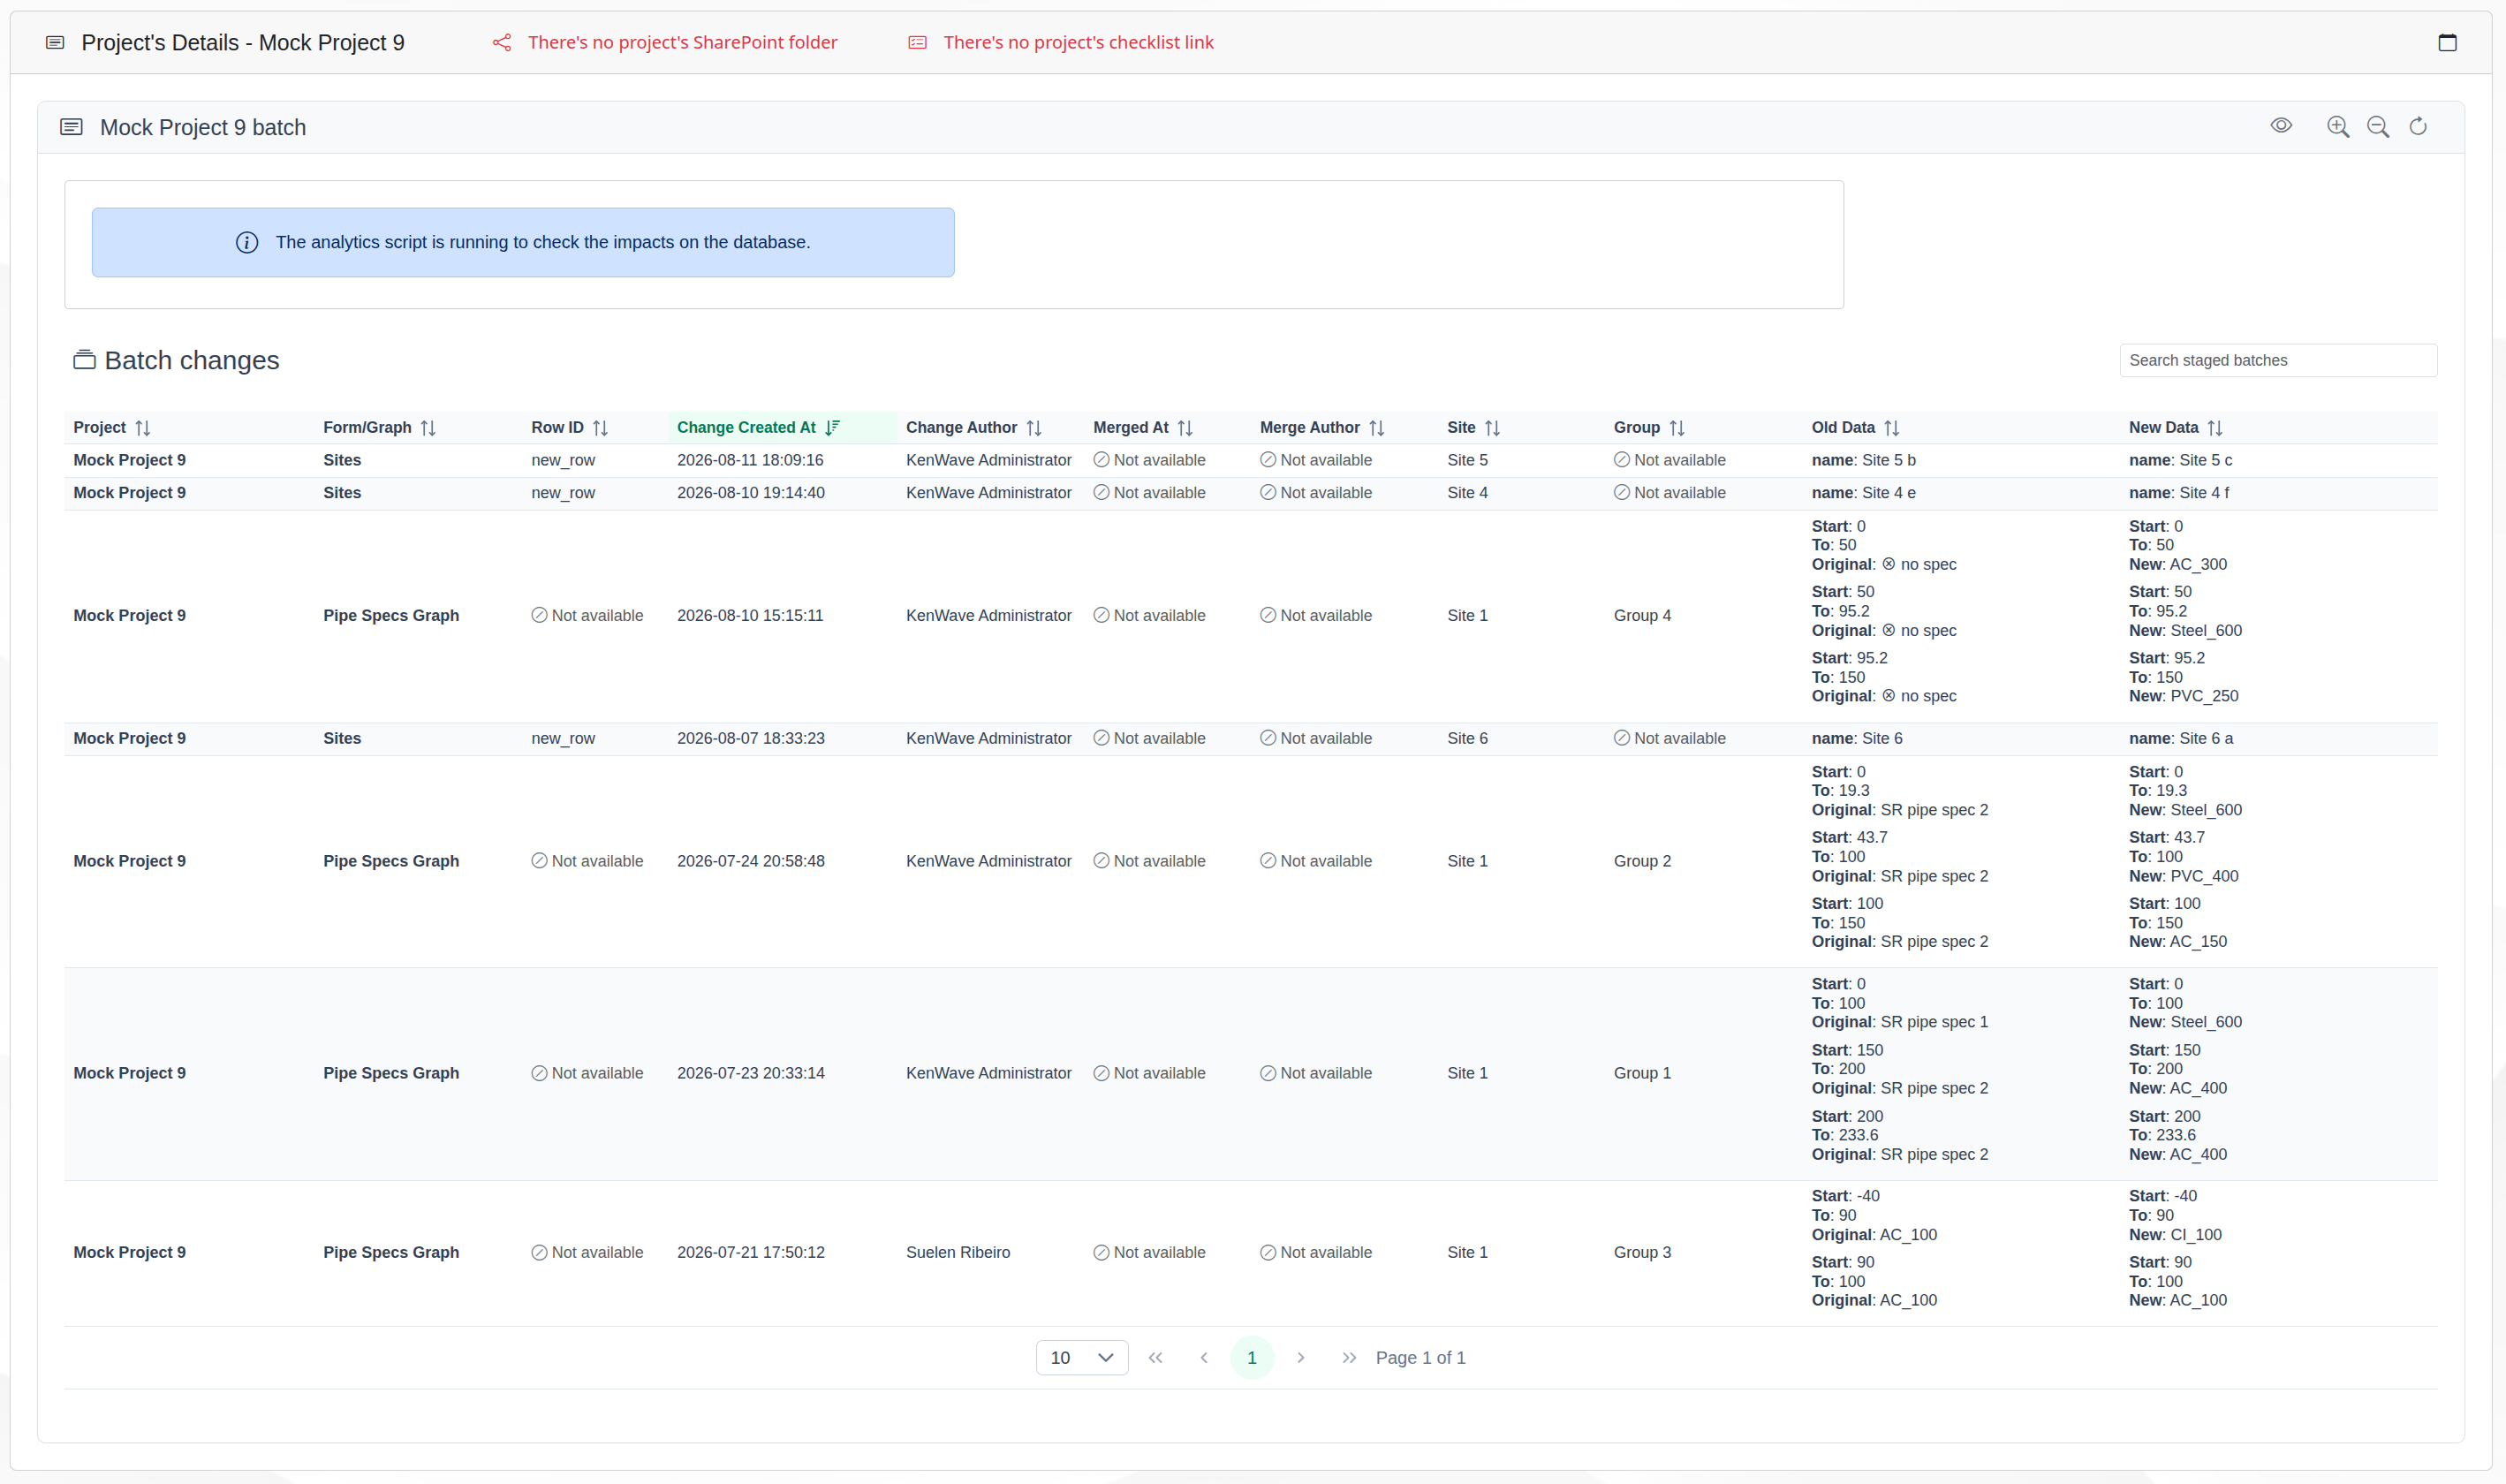
the changes are being analyzed to determine their impact on the database.
The figure below shows the backend analysis alert.
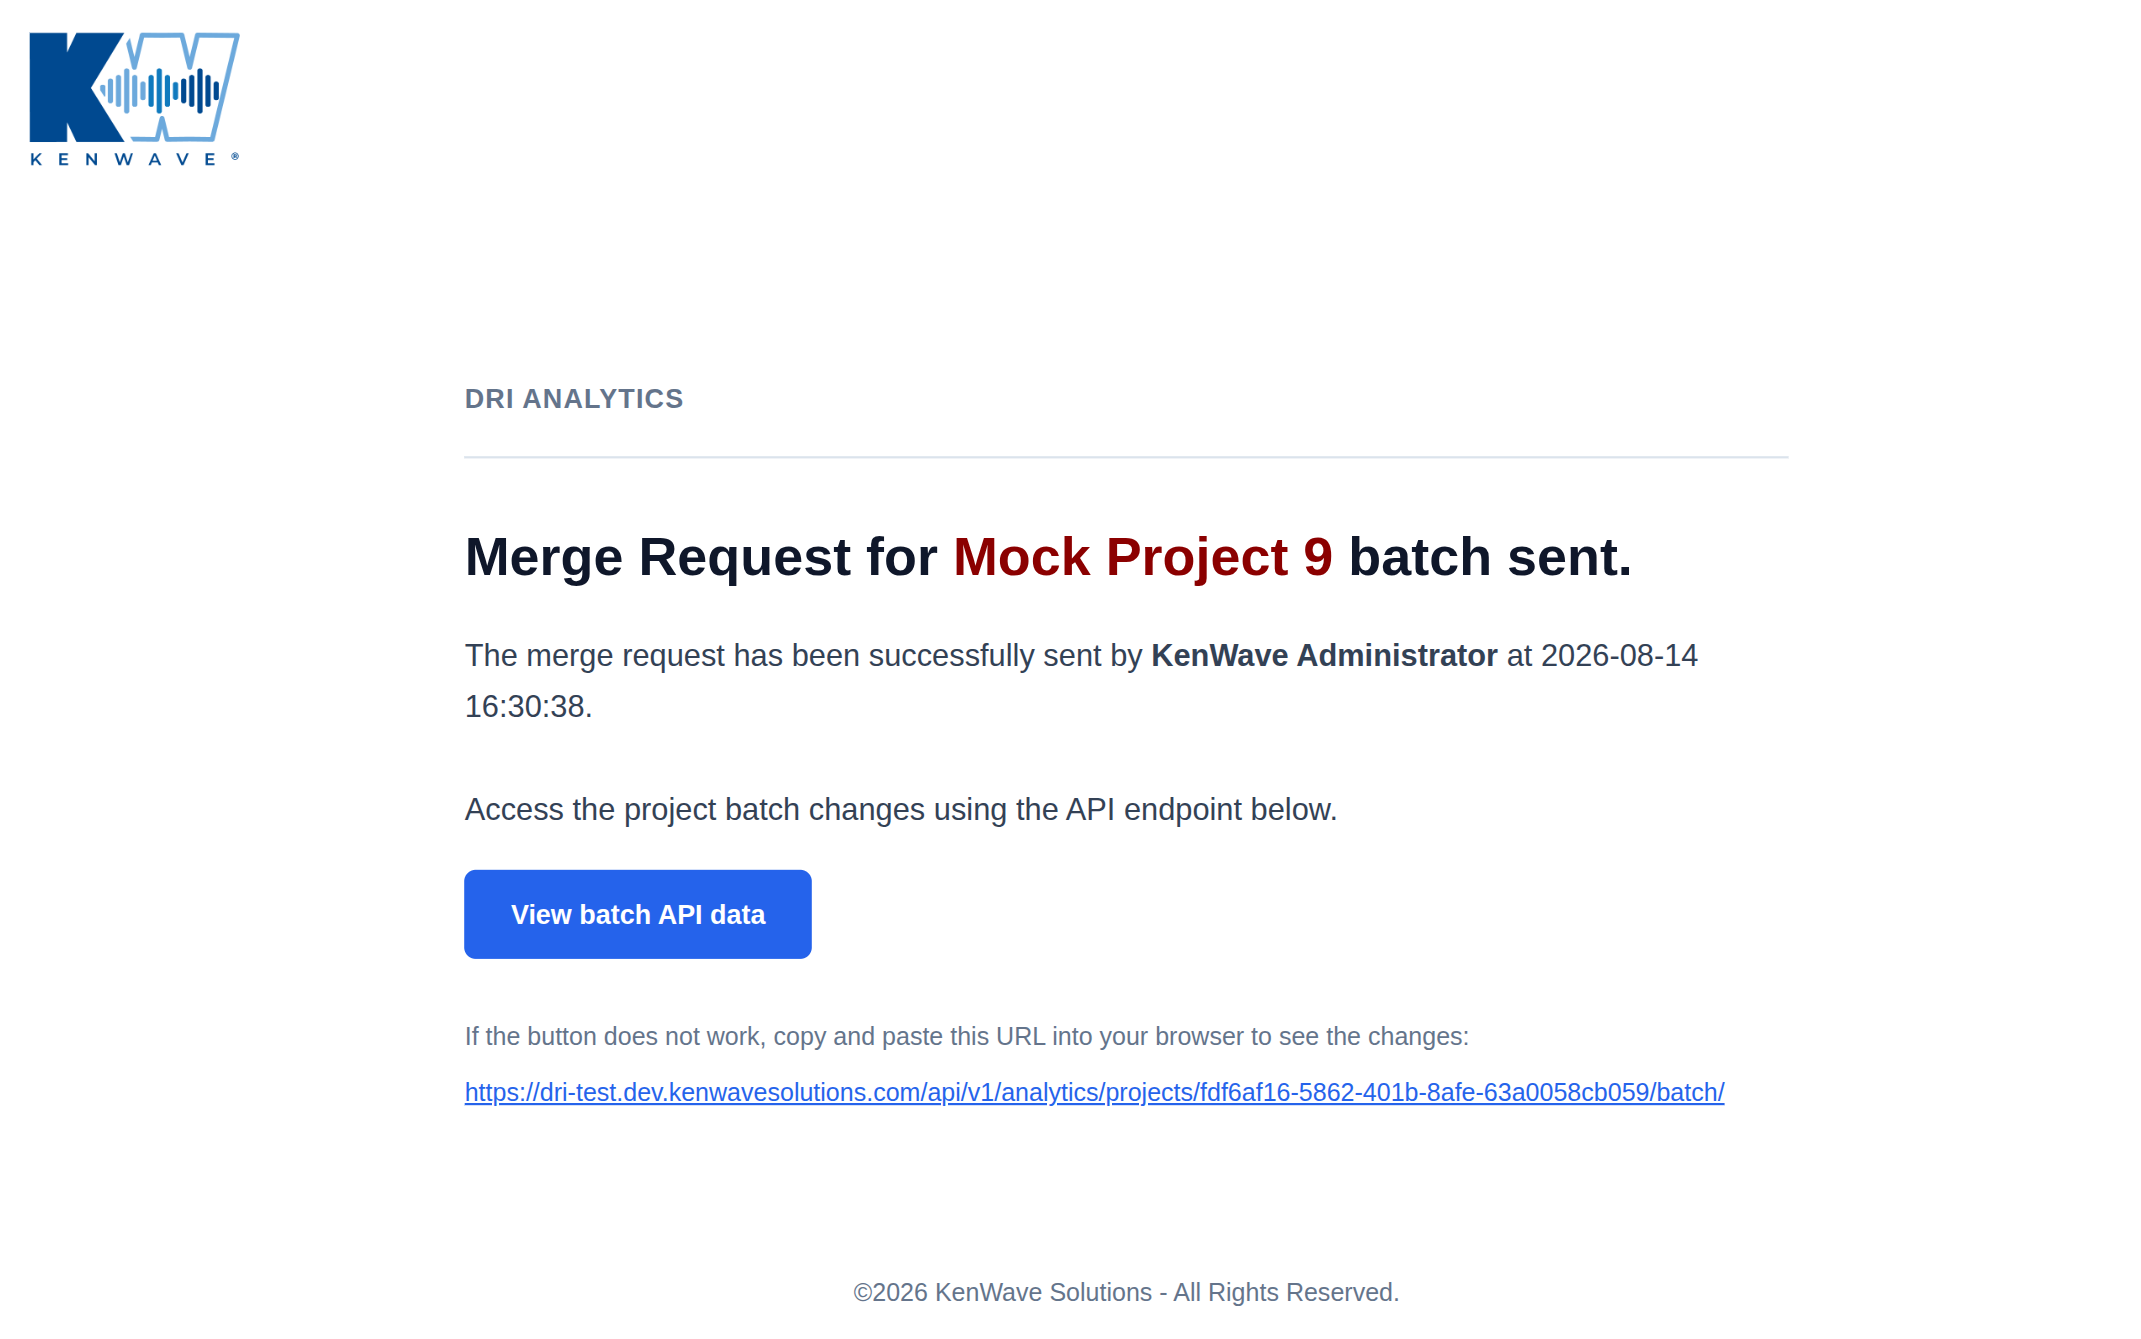
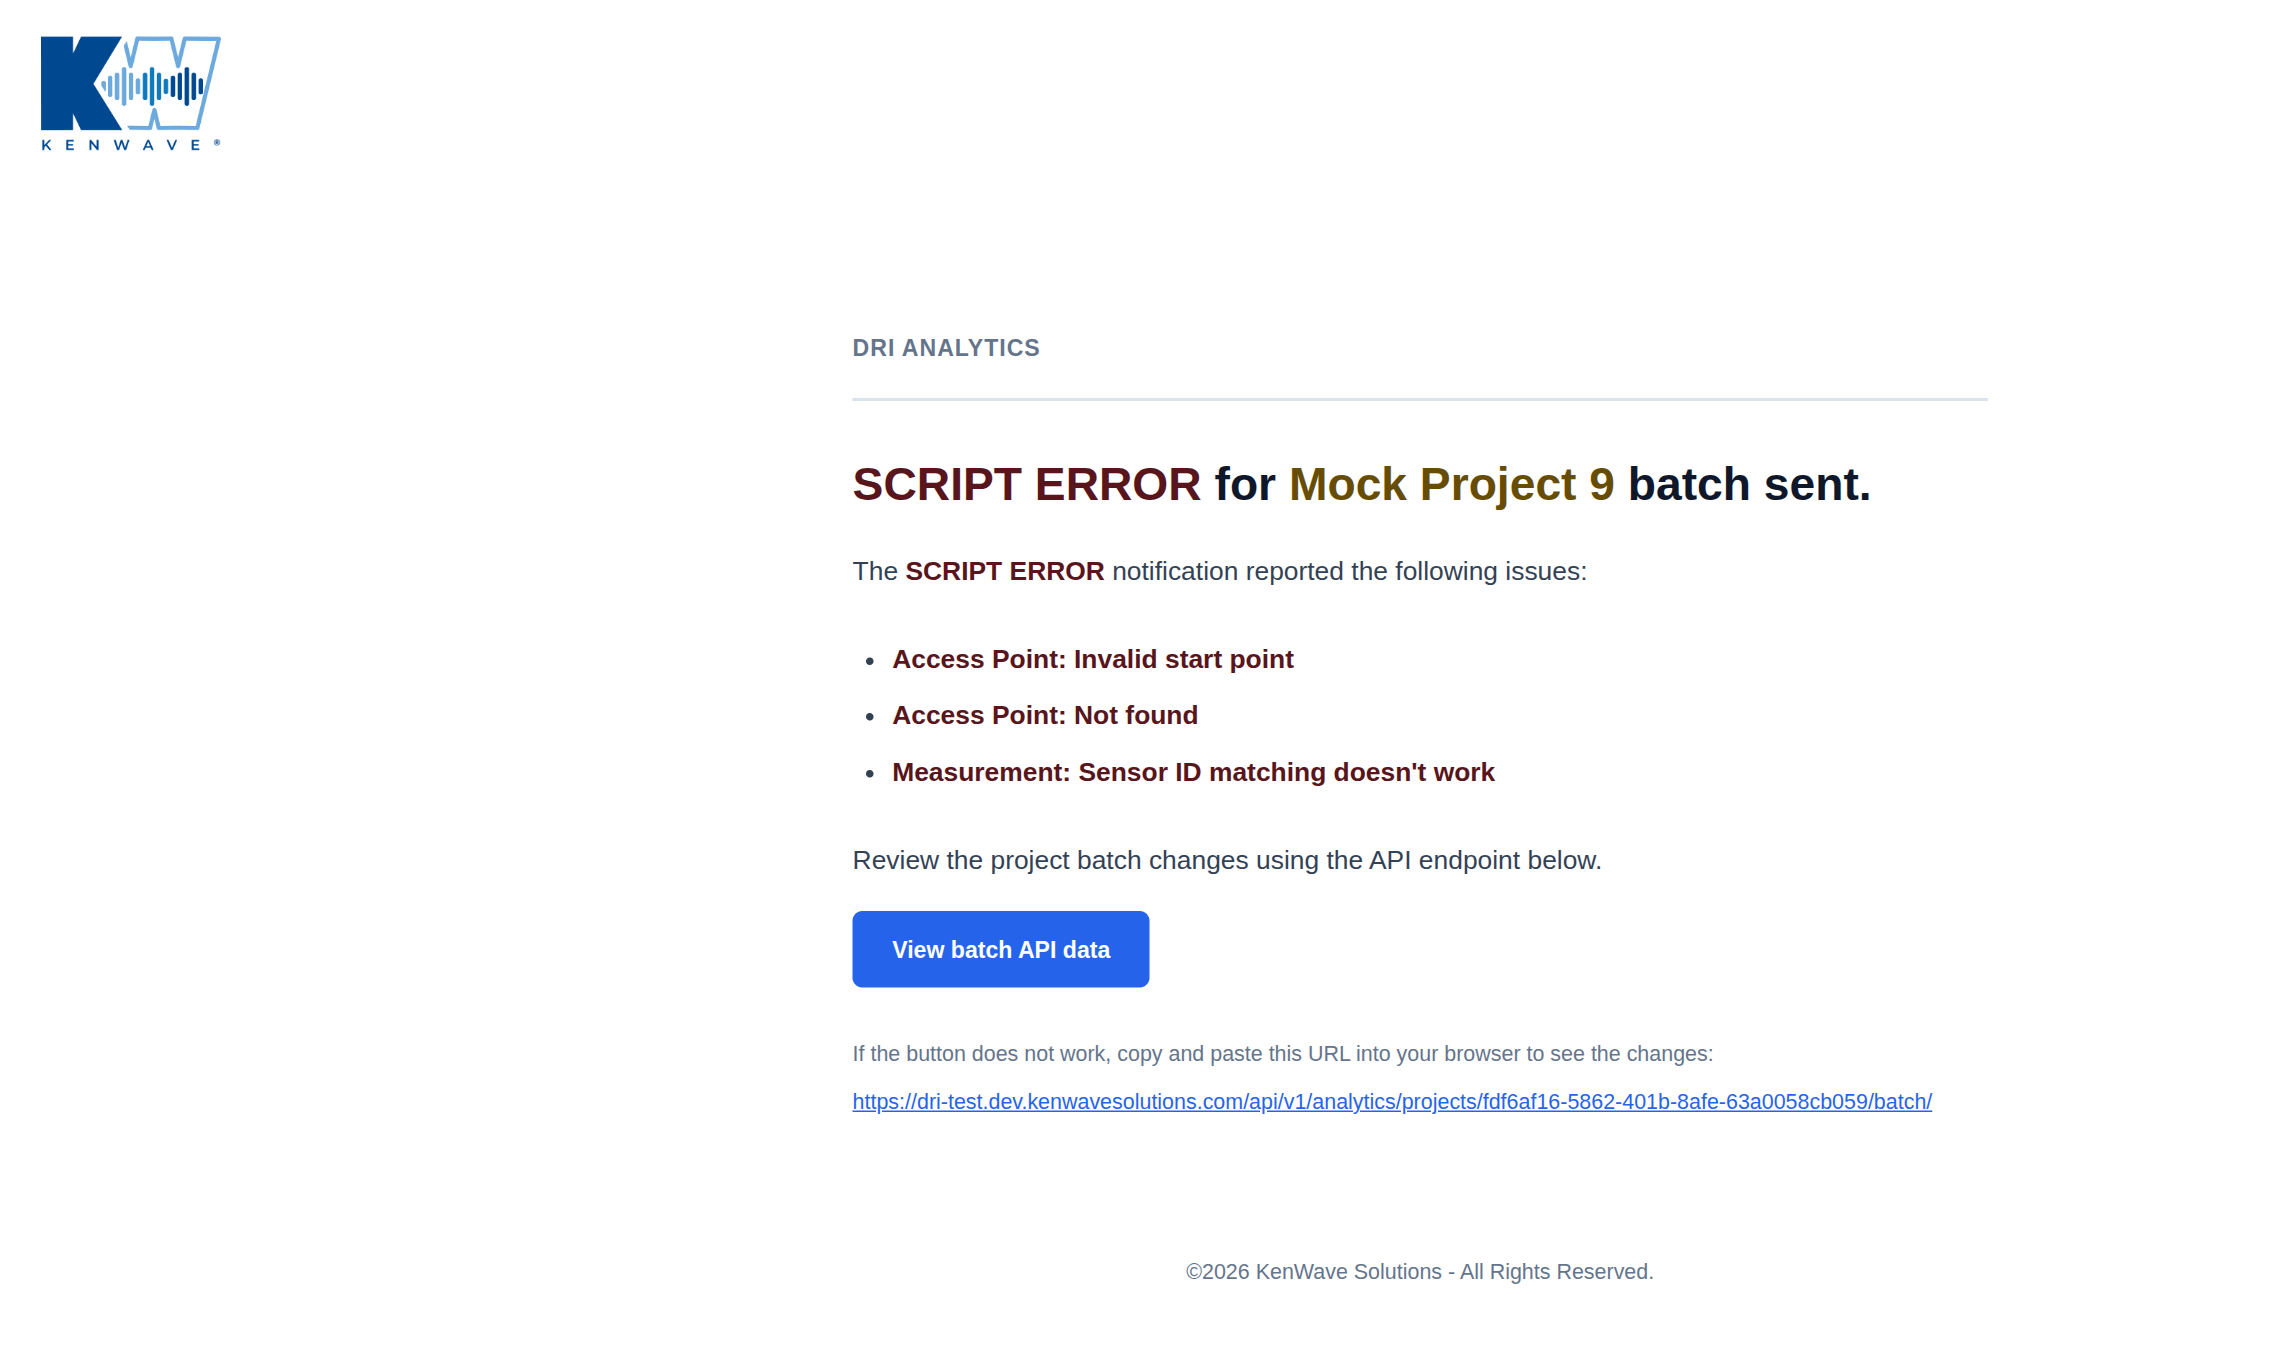
At the same time, an email is sent to the Analytics team with the request details and a link to the API endpoint where they can review the content. The Merge Request button is also hidden. See the figure below.
After that, the analytics backend script returns a result to the Stage tab.
Merge Request Results
Depending on the results of the analytics backend script, three outcomes are possible:
| No impacts | The batch changes have no impact on the analytics database, so no further action is necessary, and the cycle is complete. | |
| Impacts | The batch changes affect the analytics database, and an analytics team member should decide whether to commit or deny the changes. | |
| Script errors | The analytics script encountered one or more errors and could not continue checking for impacts. An analytics team member should review the issue and propose a solution, using a manual workaround if necessary. |
No Impacts
If the batch changes do not affect the integrity of the analytics database, no further action is needed. Therefore, the analytics database tables are updated automatically.
A no-impacts alert appears. See the figure below.
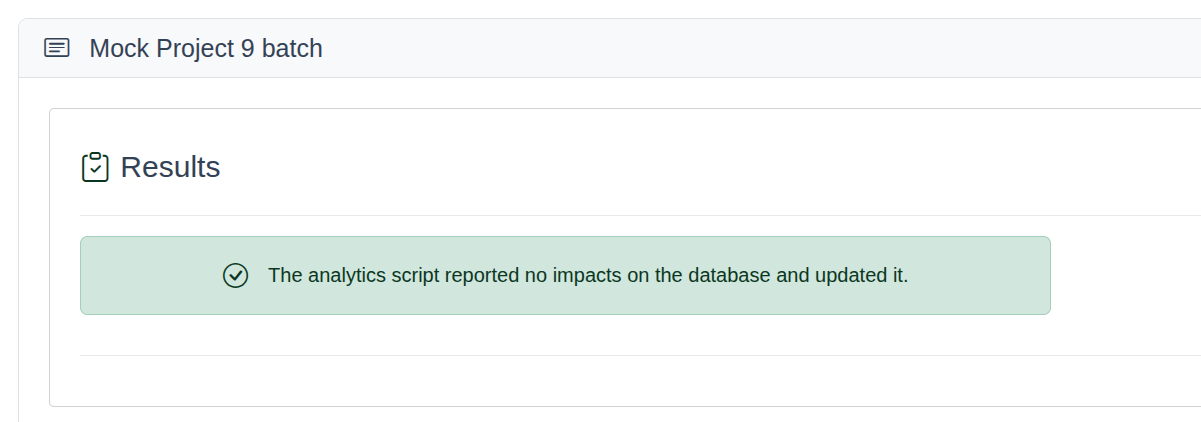
After that, the project’s batch changes are removed, and the cycle is complete.
Impacts
If the batch changes affect the analytics database, a list of impacts is displayed. See the figure below.
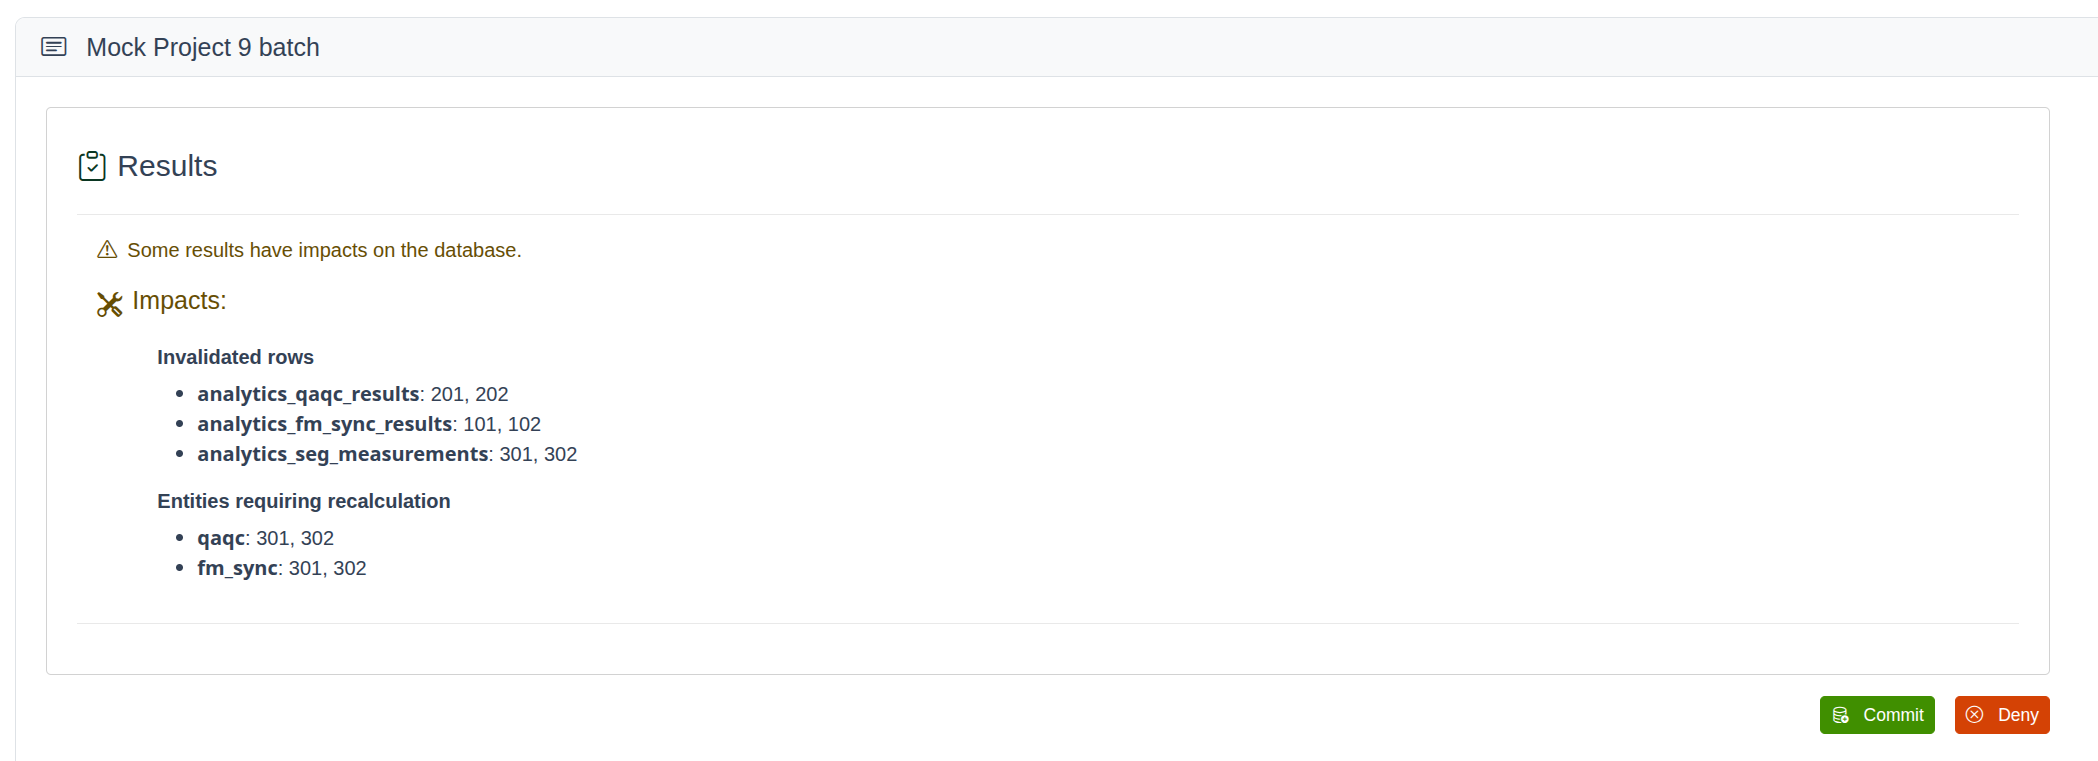
After that, an analytics team member should decide whether to commit or deny the changes using the Commit or Deny buttons.
Script Errors
If the analytics script encounters errors during execution, it is not possible to determine whether the changes will affect the analytics database. In this case, an error alert with a list of errors is displayed on the Stage tab. See the figure below.
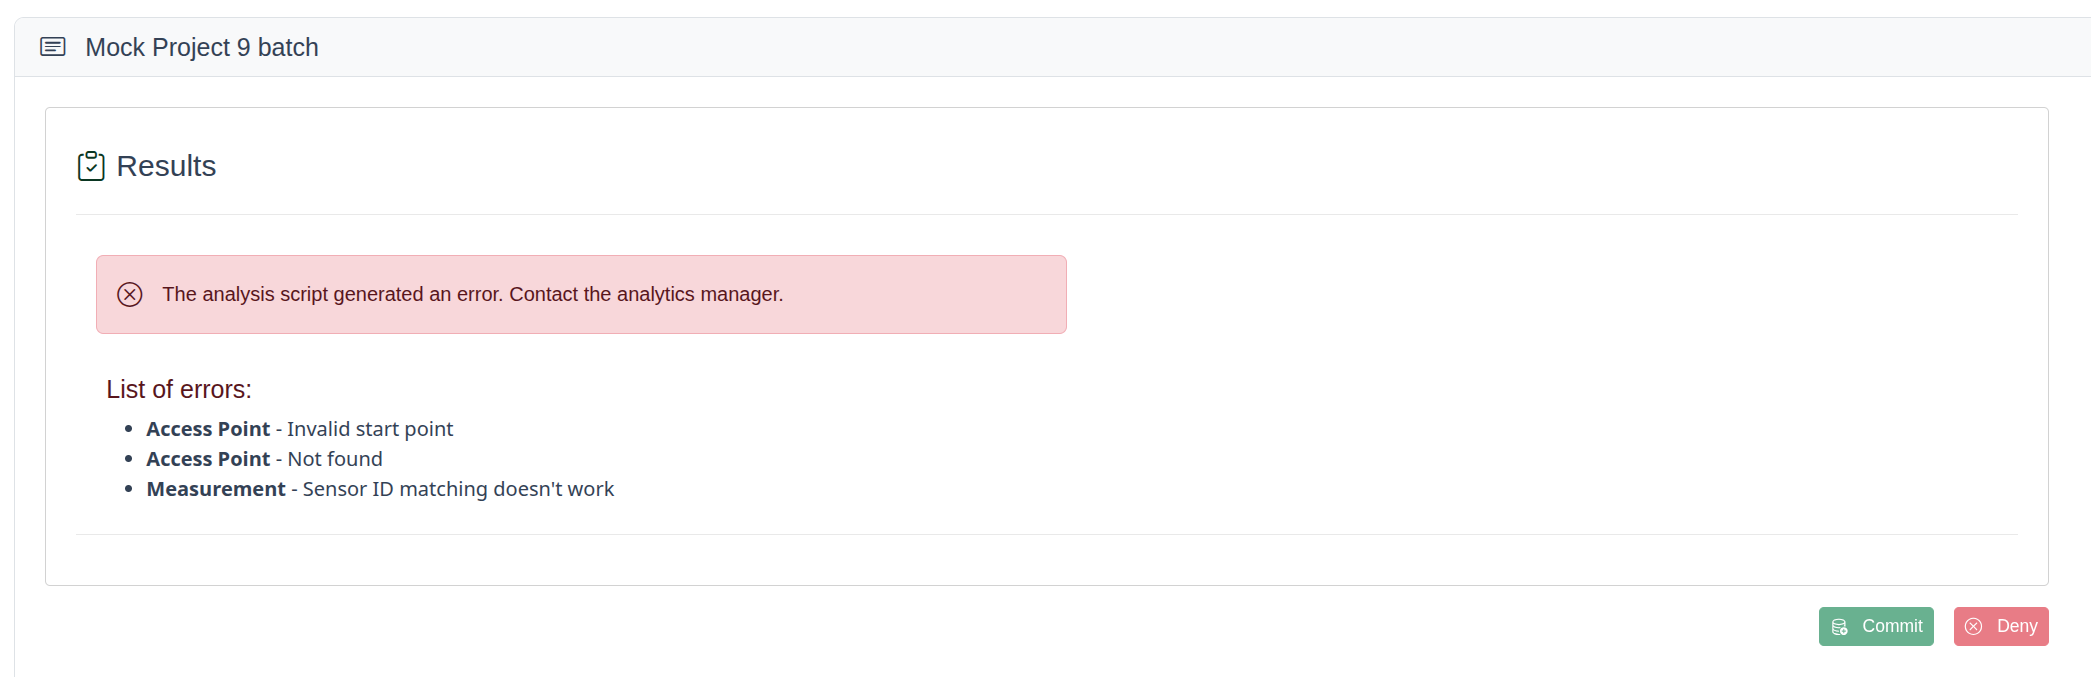
After that, an analytics team member should review the issue and, if necessary, resolve it manually. The figure below shows an example of the email notification for the script error status:
Commit Changes
After the analytics backend script processes the changes, it checks whether they affect the analytics database. Two outcomes are possible:
there are no impacts
there are impacts
The Commit button appears only when:
the merge-request flow is active, which means the Merge Request button has already been clicked.
the analytics backend script did not return any errors.
a stored result exists after the analytics backend script has run.
the result includes impacts.
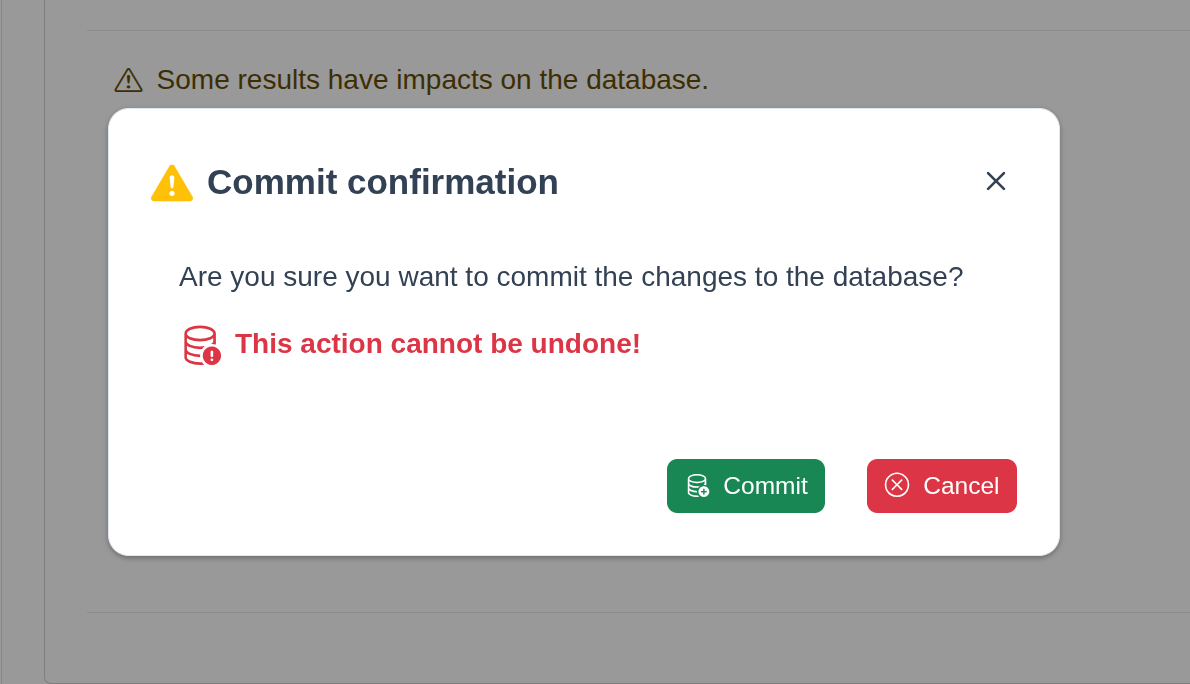
When a KW Analyst user clicks the Commit button, a confirmation dialog appears. The figure below shows the confirmation window:
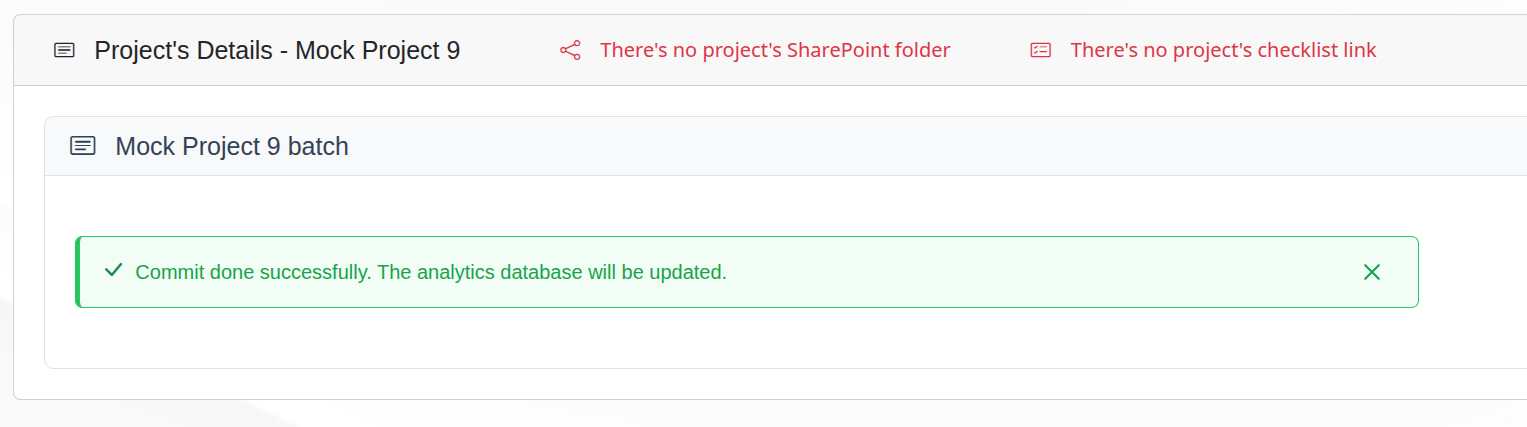
After this operation, four things happen:
the Stage tab is cleared for the project the next time the tab loads.
the analytics database is updated with the committed changes.
the analytics team receives an email notification regarding the commit action.
the project’s current batch lifecycle is complete.
The figure below shows an example of the commit email notification.
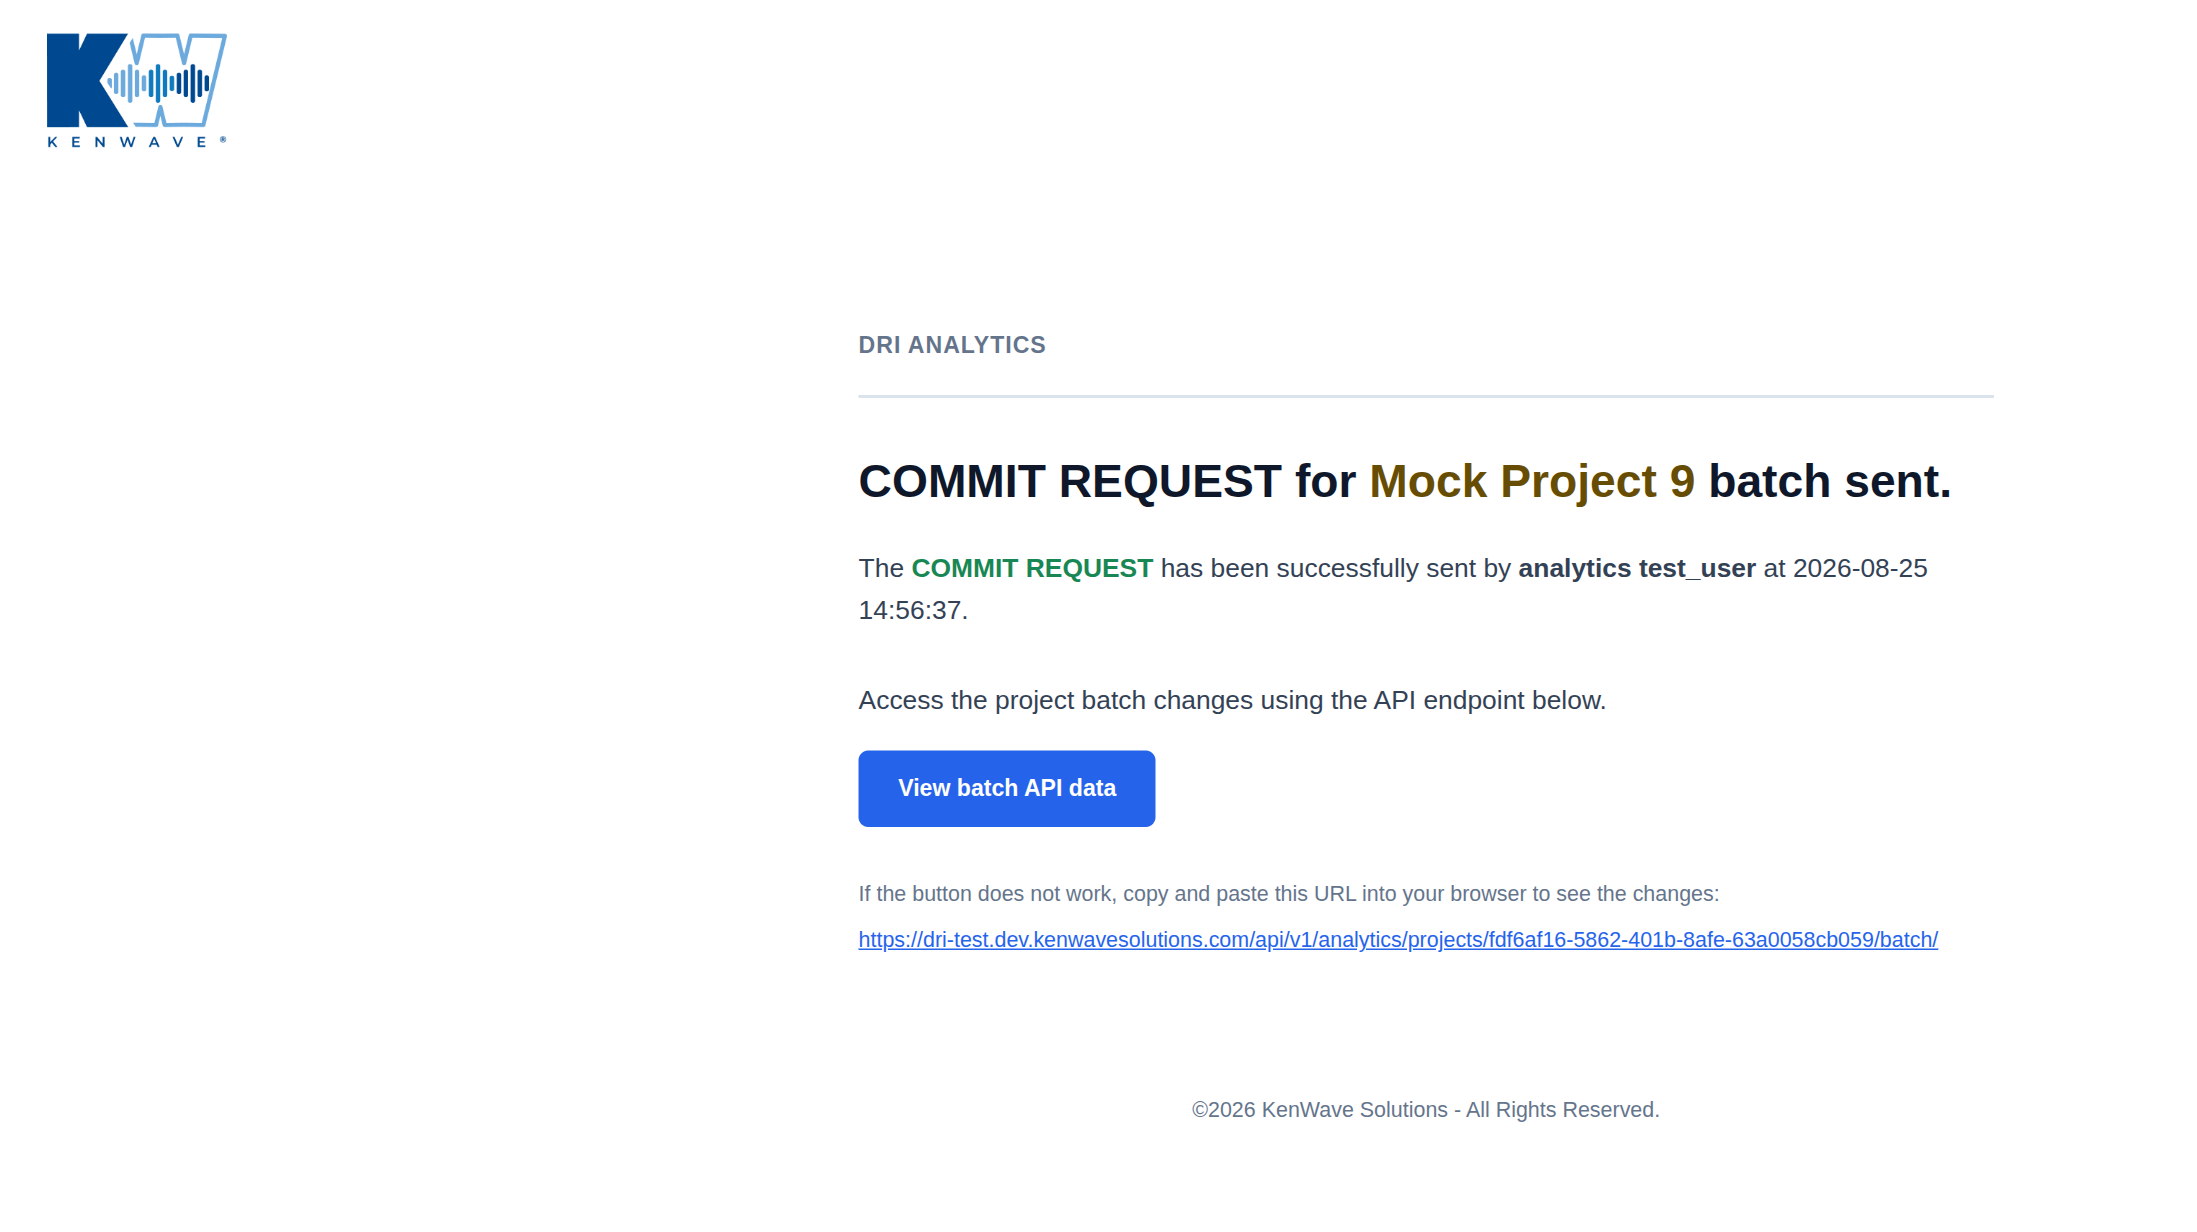
The project’s Stage tab is now ready to receive new user changes.
Deny Changes
After the analytics backend script processes the changes, it checks whether they affect the analytics database. Two outcomes are possible:
there are no impacts
there are impacts
The Deny button appears only when:
the merge-request flow is active, which means the Merge Request button has already been clicked.
the analytics backend script did not return any errors.
a stored result exists after the analytics backend script has run.
the result has impacts.
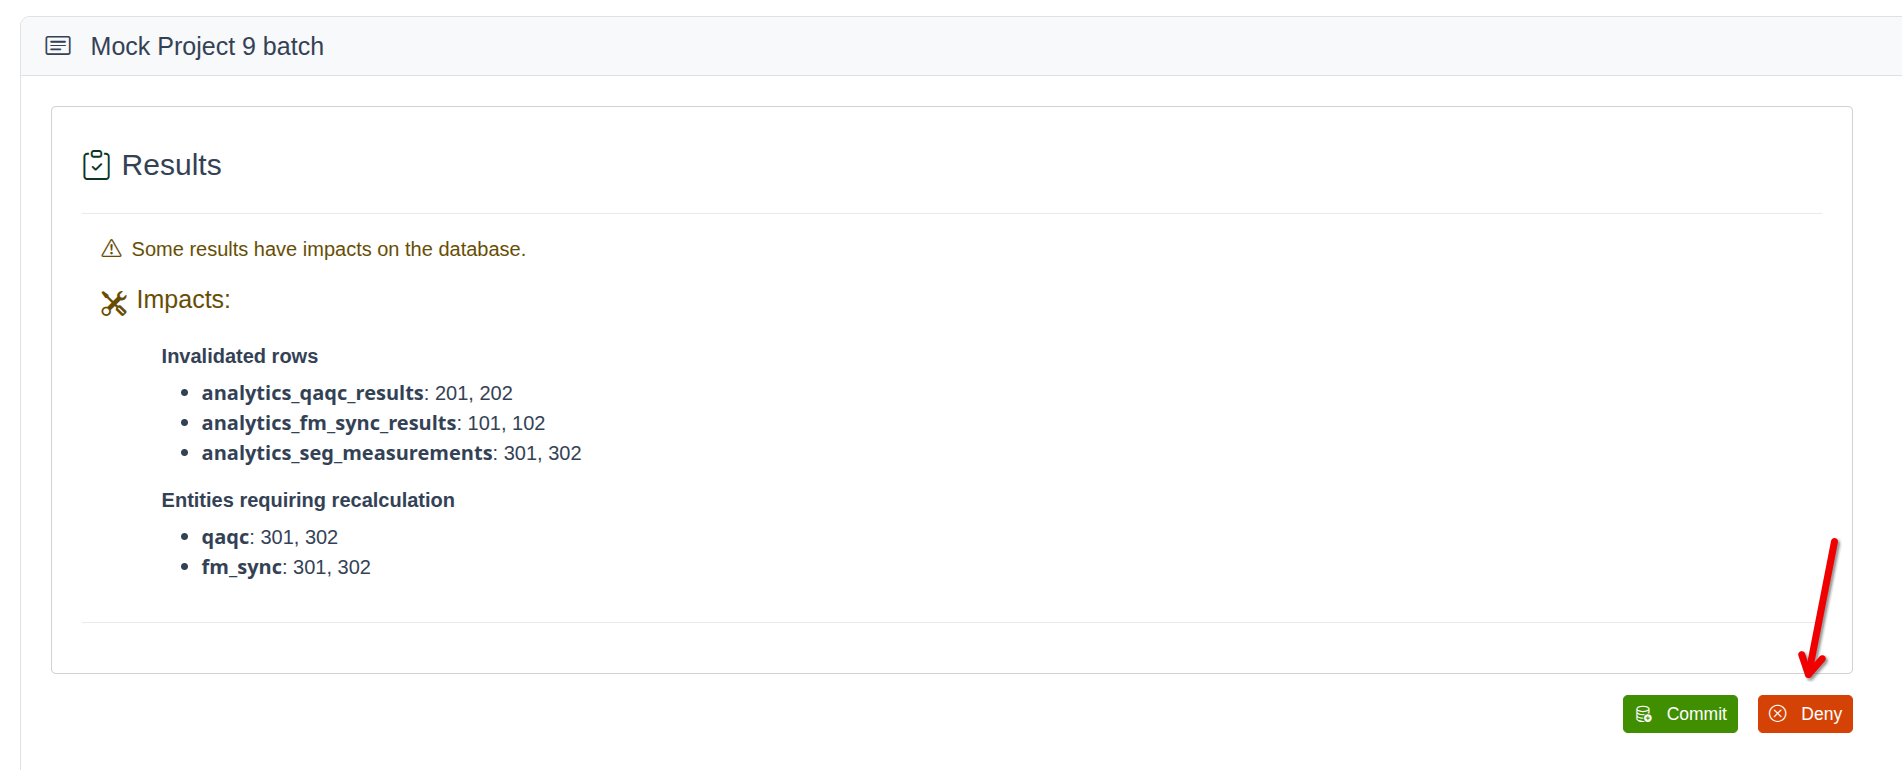
When a KW Analyst user clicks the Deny button, a confirmation dialog appears. The figure below shows the confirmation window:
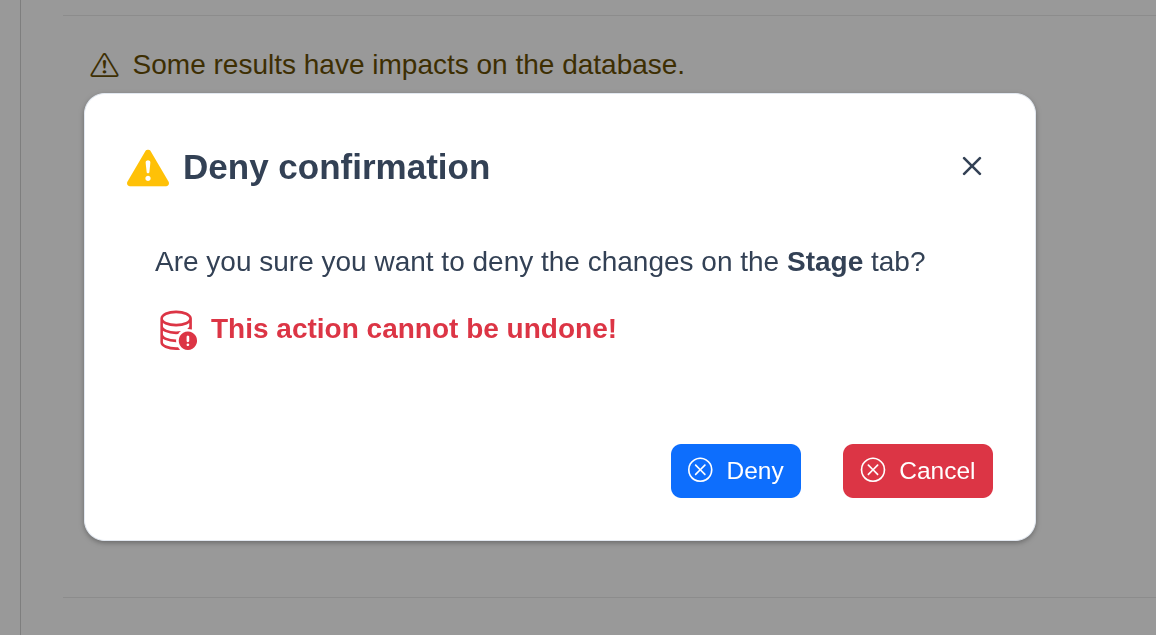
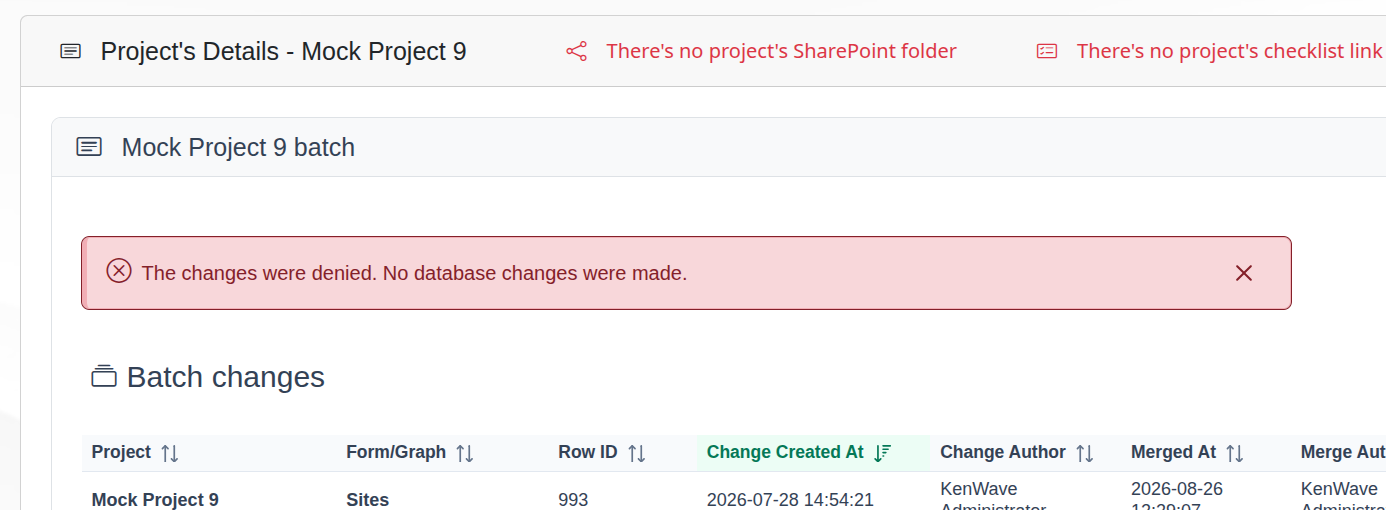
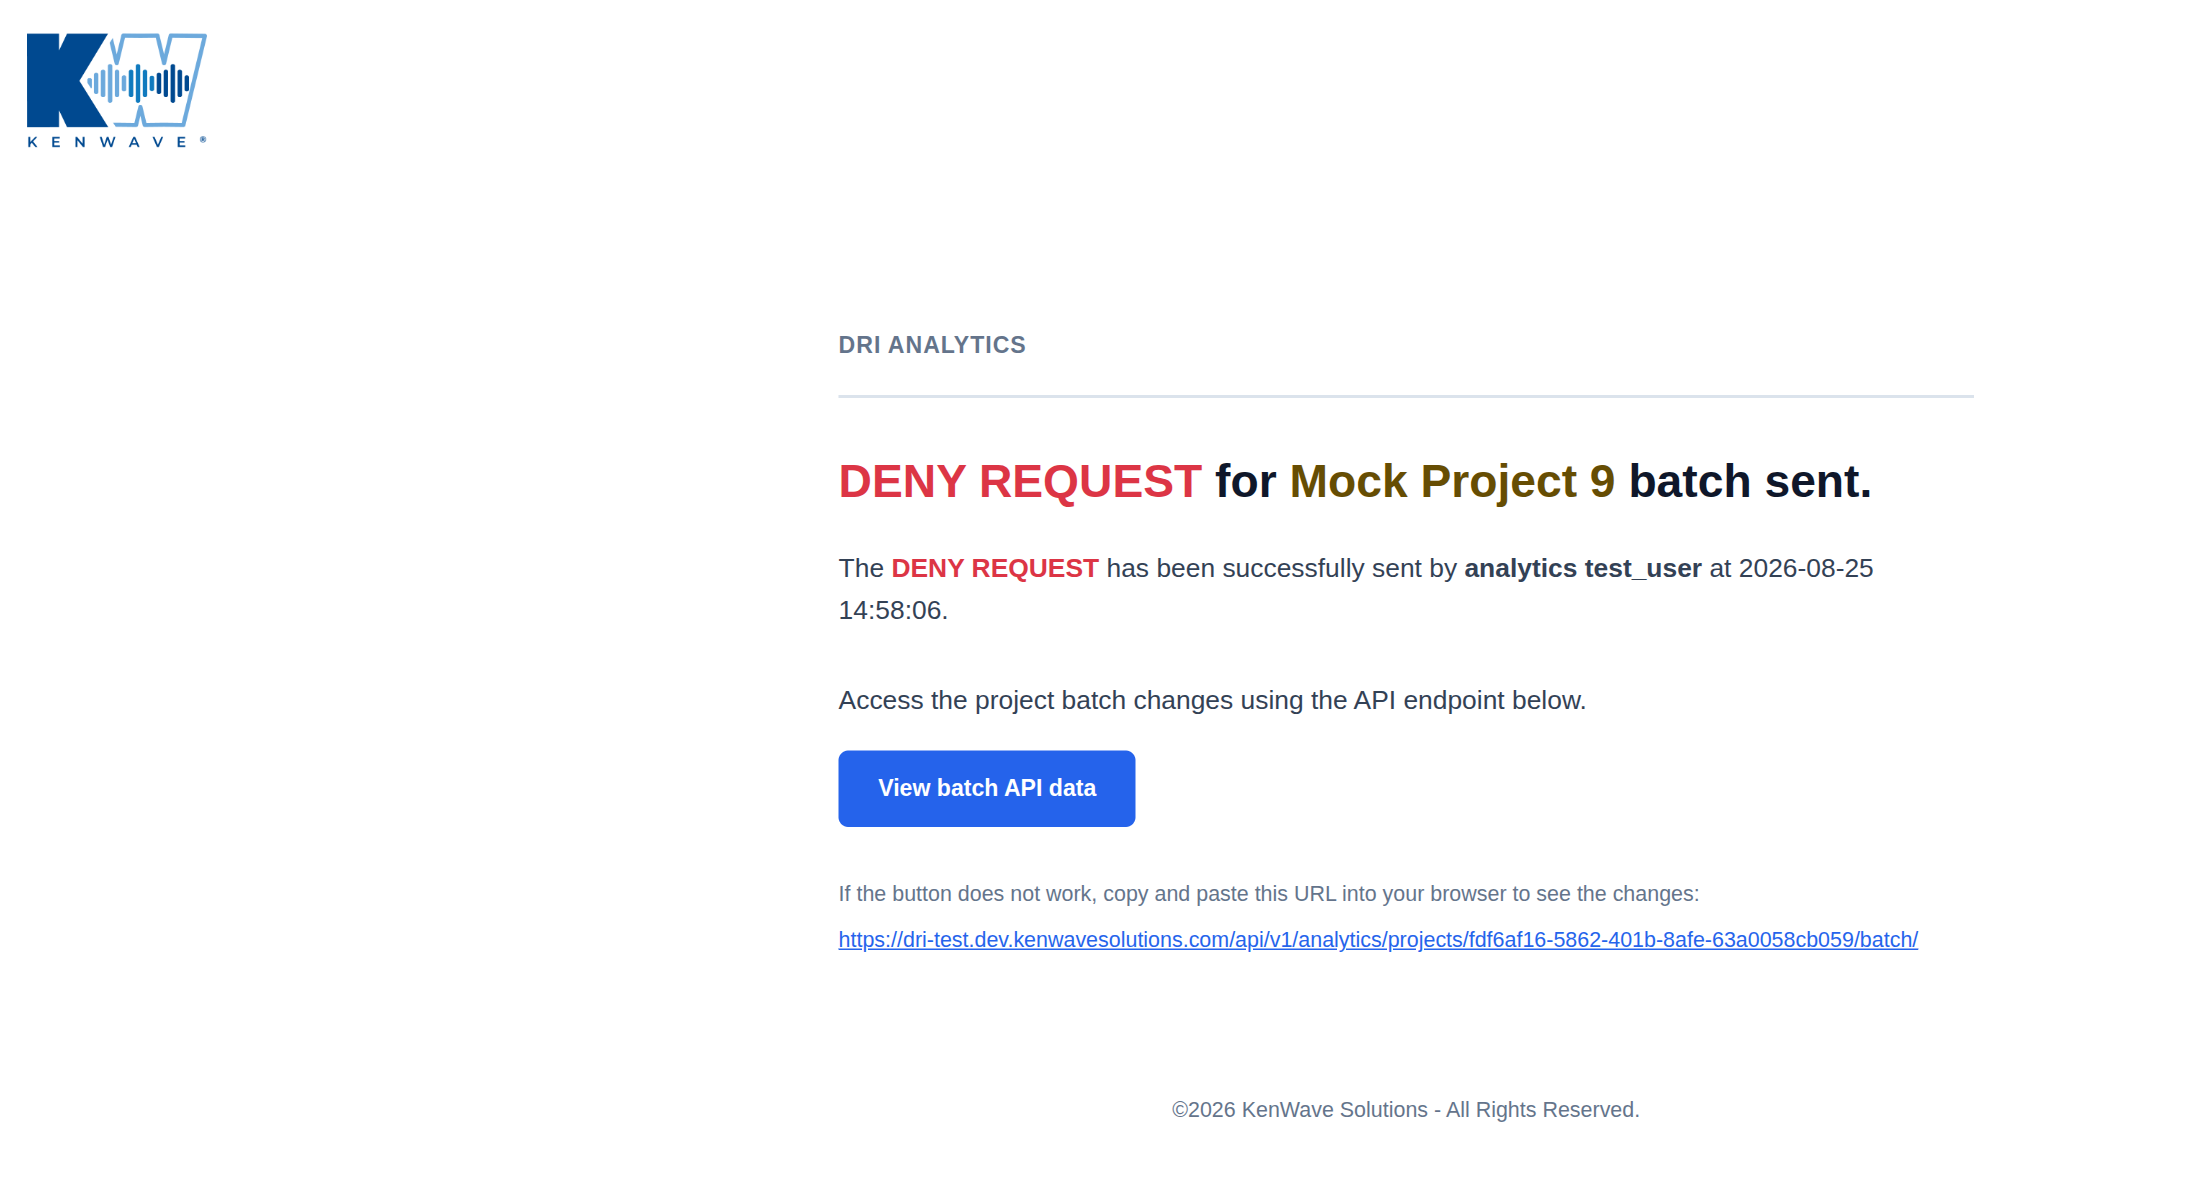
After this operation, four things happen:
the Stage tab is cleared for the project the next time the tab loads.
the analytics database remains unchanged.
the analytics team receives an email notification regarding the deny action.
the project’s current batch lifecycle is complete.
The figure below shows an example of the deny email notification.
The project’s Stage tab is now ready to receive new changes from users.