See Telemetry Data
To see a device’s telemetry data, follow the steps below.
Open the telemetry page
On the navbar, click on the Devices link; the Device Management page opens showing a list of available devices.
On the Telemetry column of the table, click on the View button; the Device Telemetry page opens showing a list of recording times.
At the right of the table, click on the Details button.
Click on the Show Graph Dashboard to see the metrics on a graphical format.
Click on the button Device Telemetry List to return to the Device Management page.
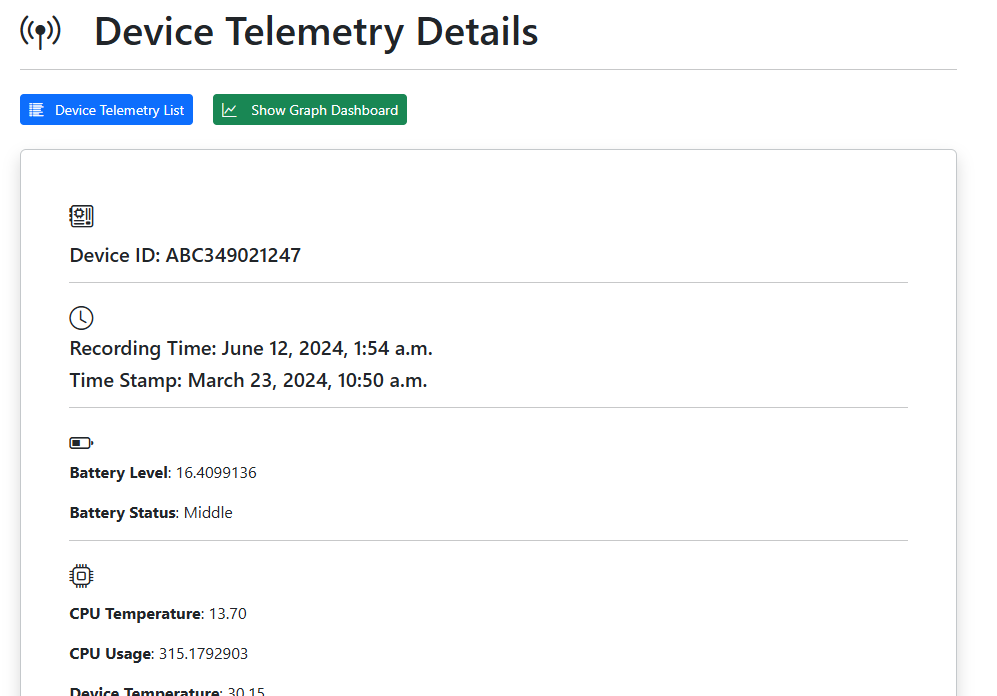
The Details buttons on the Device Telemetry page opens the respective Device Telemetry Details page, where it is possible to observe the metrics for different recording times.
The example below shows the telemetry information relative to the device ID ABC349021247, at the recording time 12:56 p.m. on September 4, 2023.
 button.
 button.
A new tab will be open on the web browser showing the metrics data on a graphical format.