Timetables
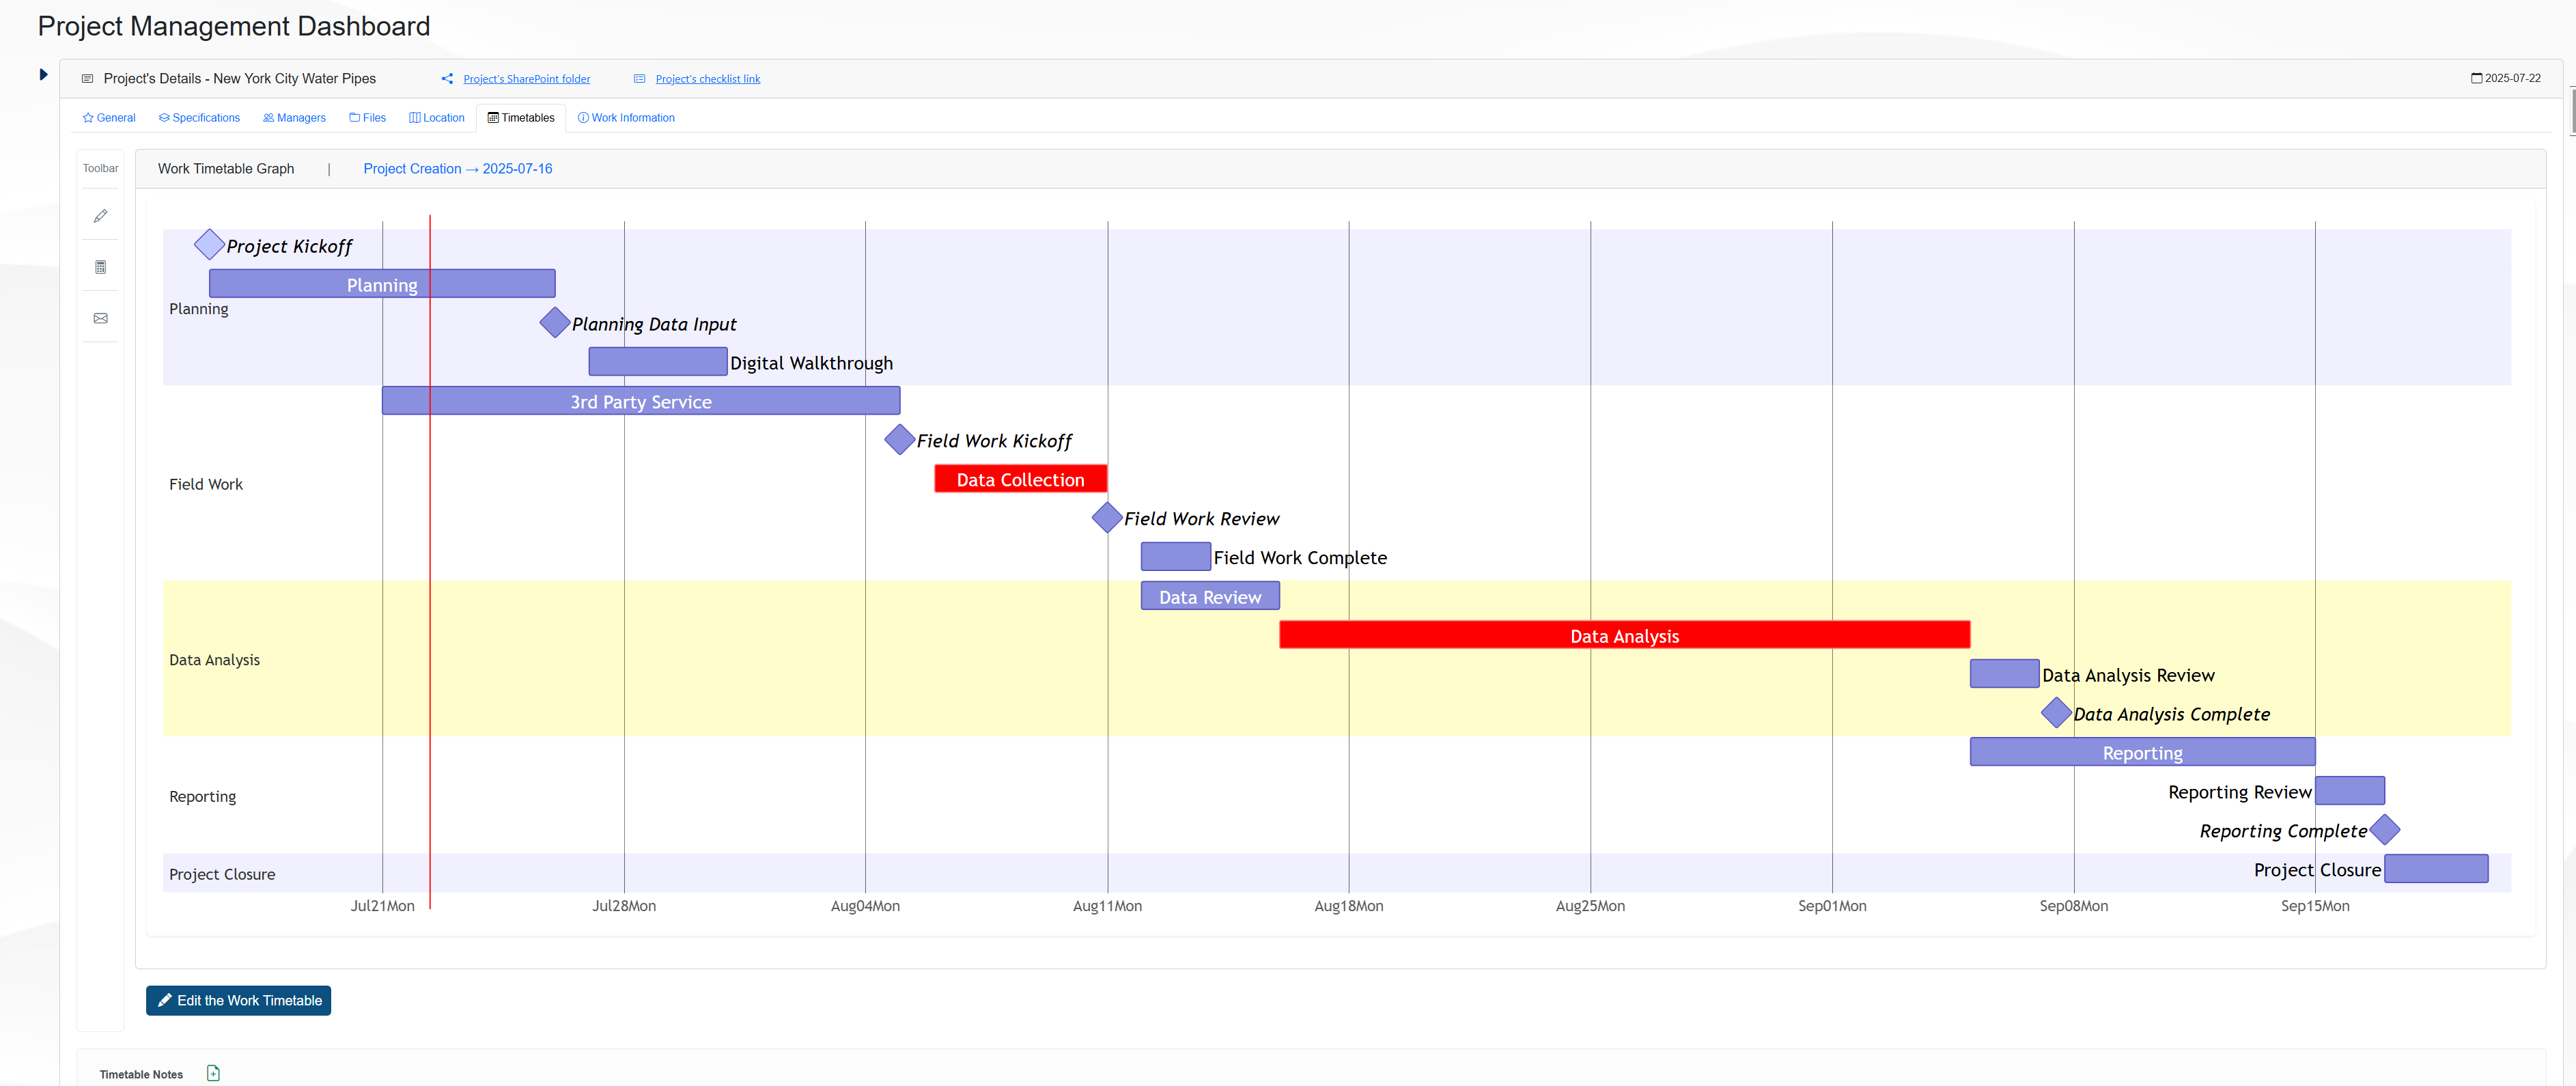
The Timetables tab on the Management page allows the user to get information about the project’s planning showing the tasks on a Gantt chart.
The figure below show an example of the Timetables tab.
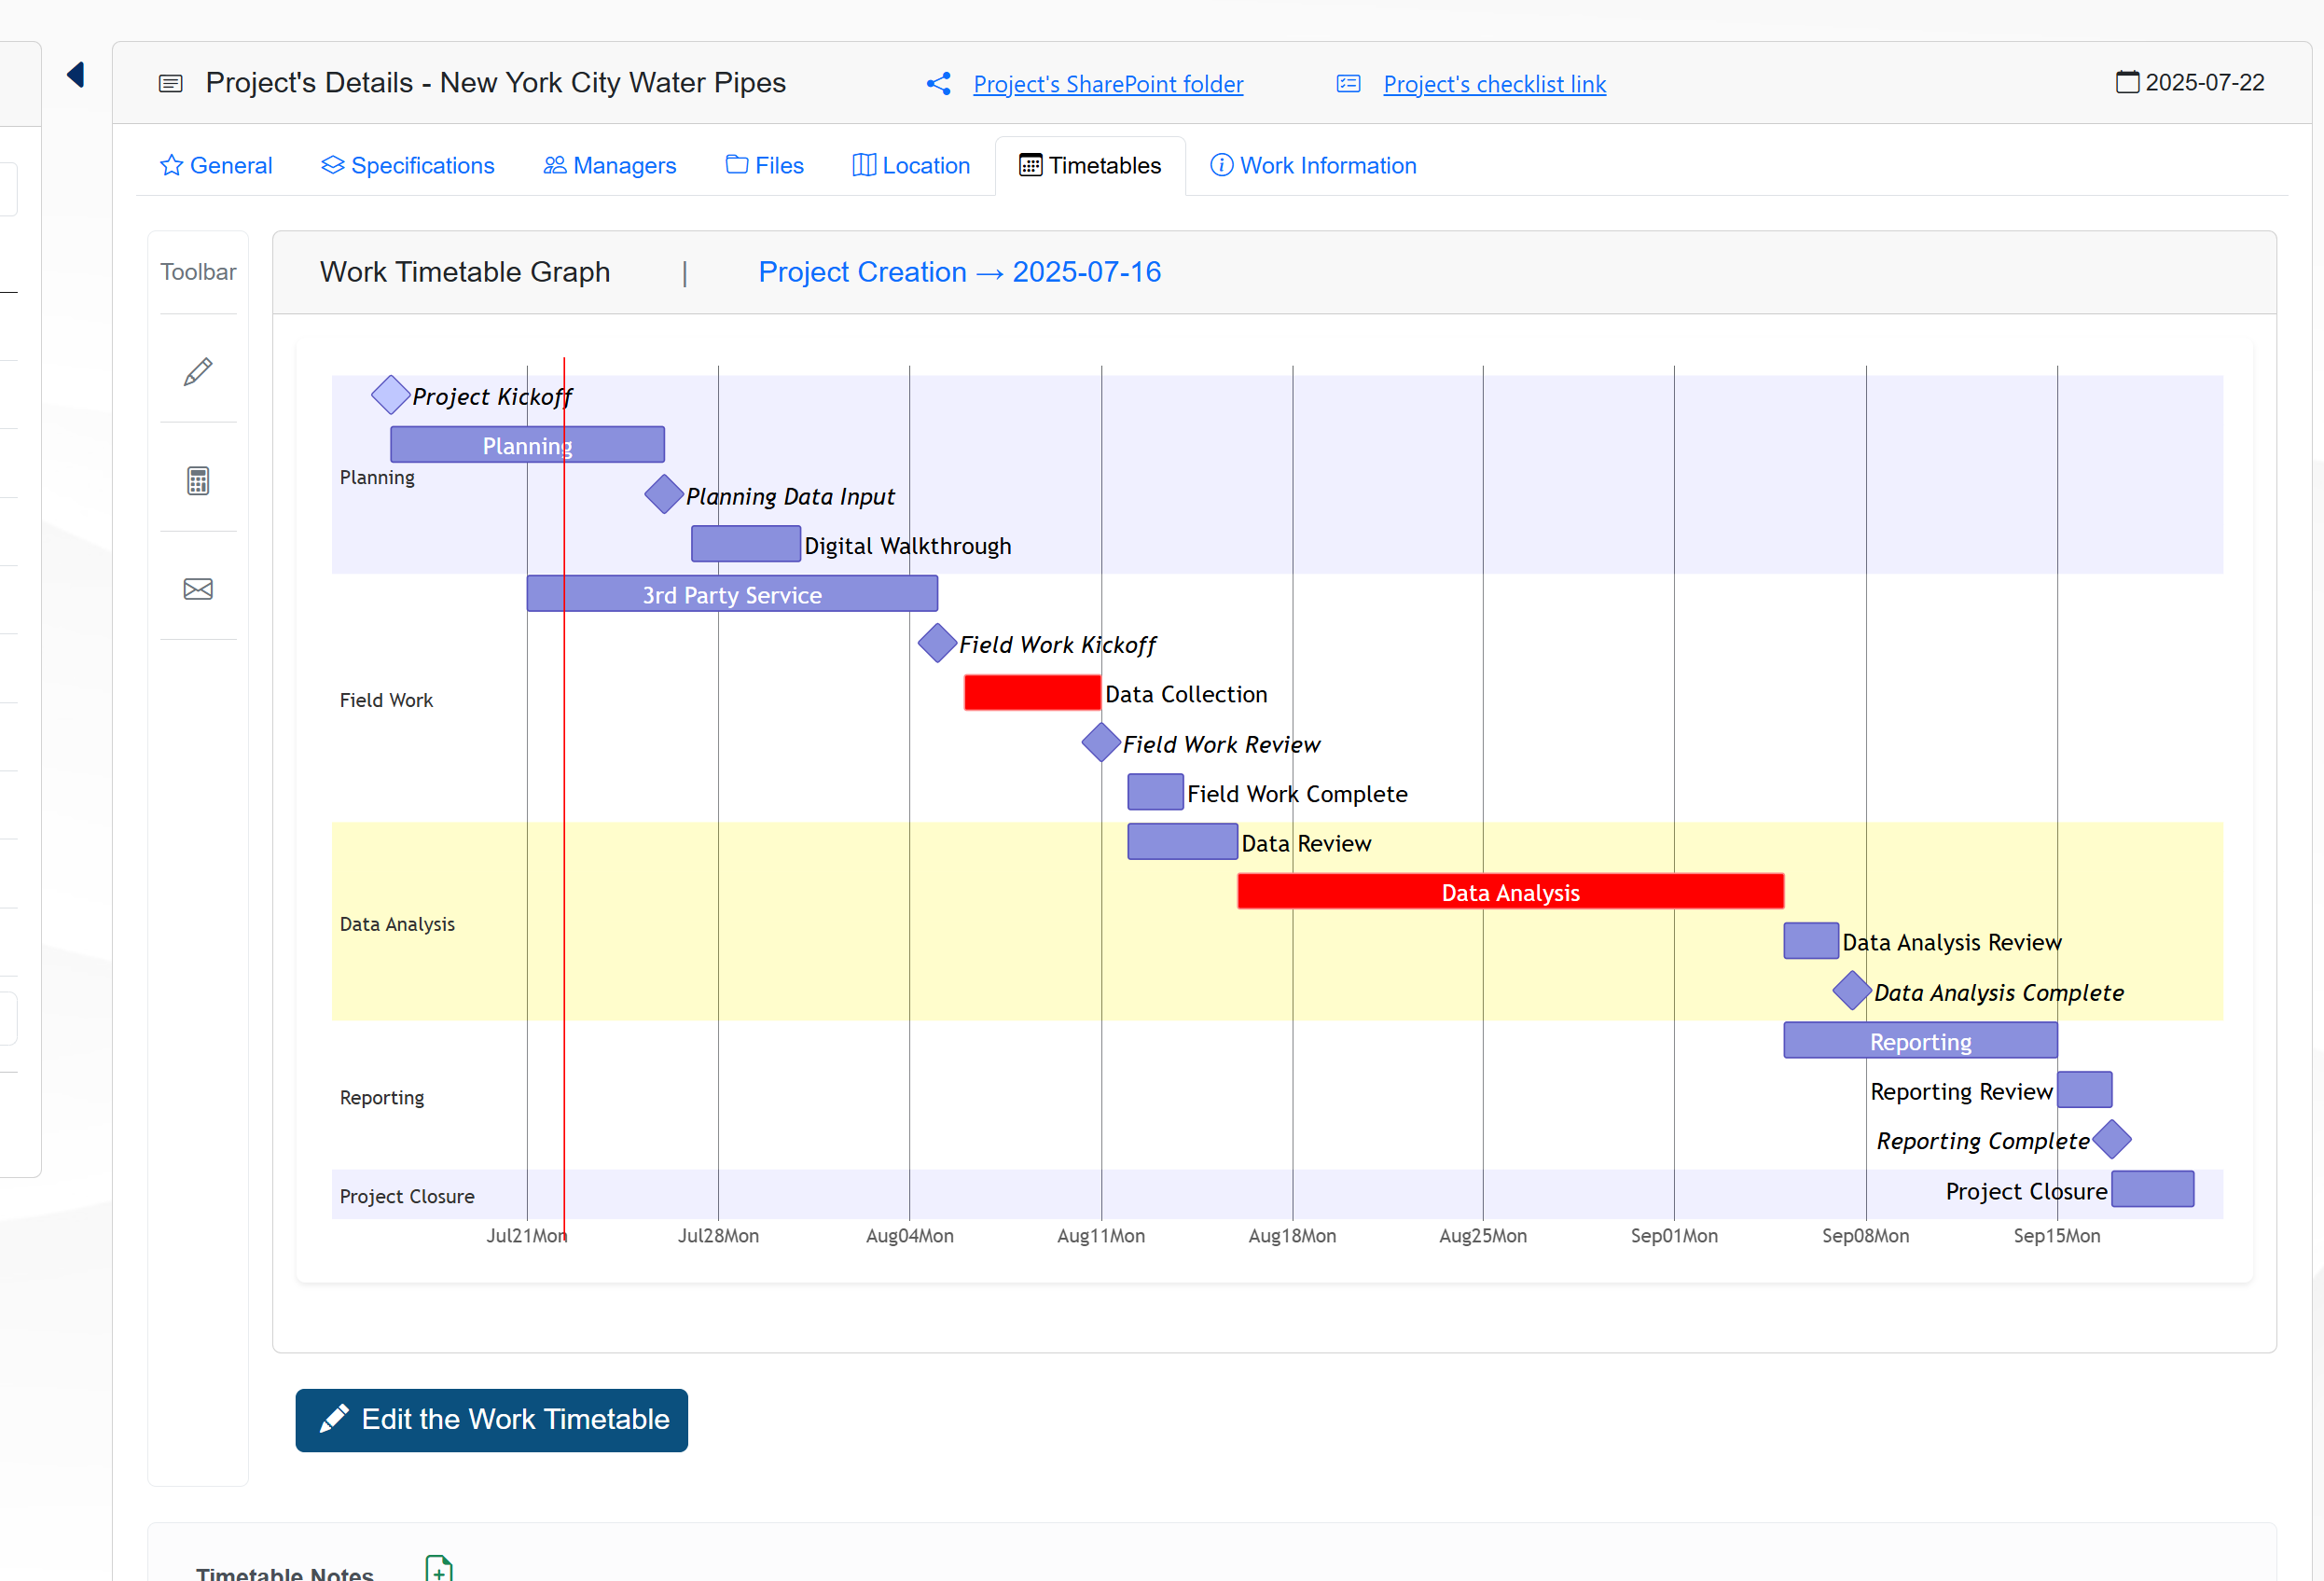
The graph shows the following tasks and milestones to manage the project:
Planning Section:
Project Kickoff milestone
Planning Task
Planning Data Input milestone
Digital Walkthrough task
Field Work Section:
3rd Party Service task
Field Work Kickoff milestone
Data Collection task
Field Work Review milestone
Field Work Complete task
Data Analysis Section:
Data Review task
Data Analysis task
Data Analysis Review task
Data Analysis Complete milestone
Reporting Section:
Reporting task
Reporting Review task
Reporting Complete milestone
Project Closure Section:
Project Closure task
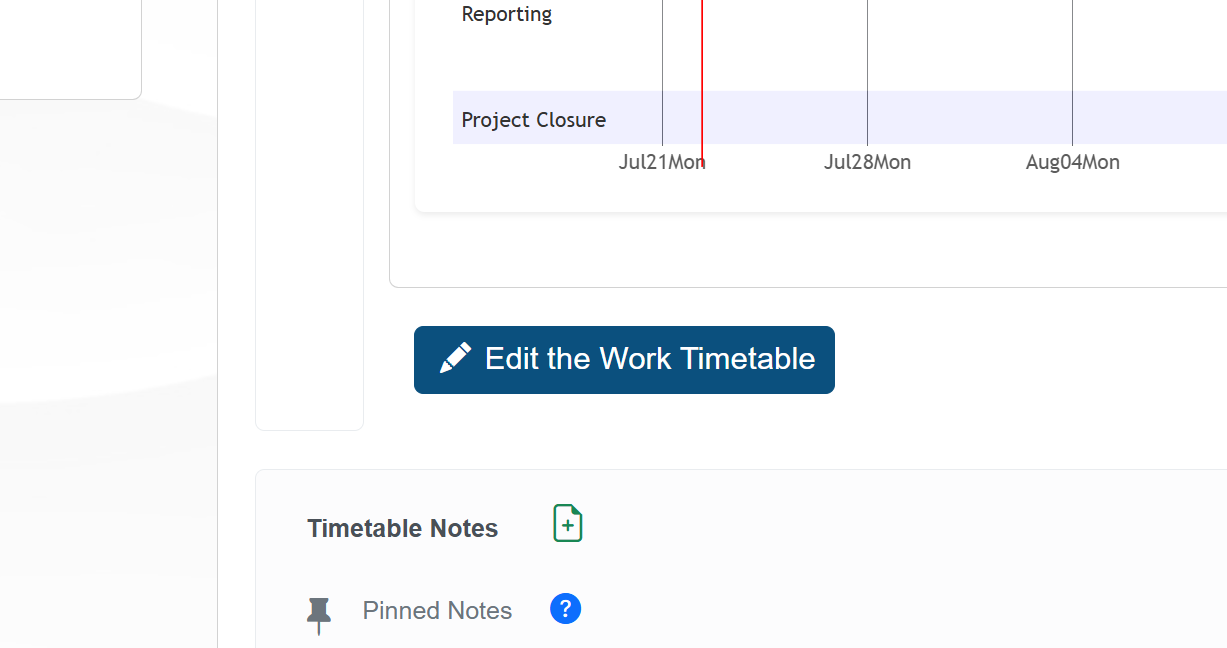
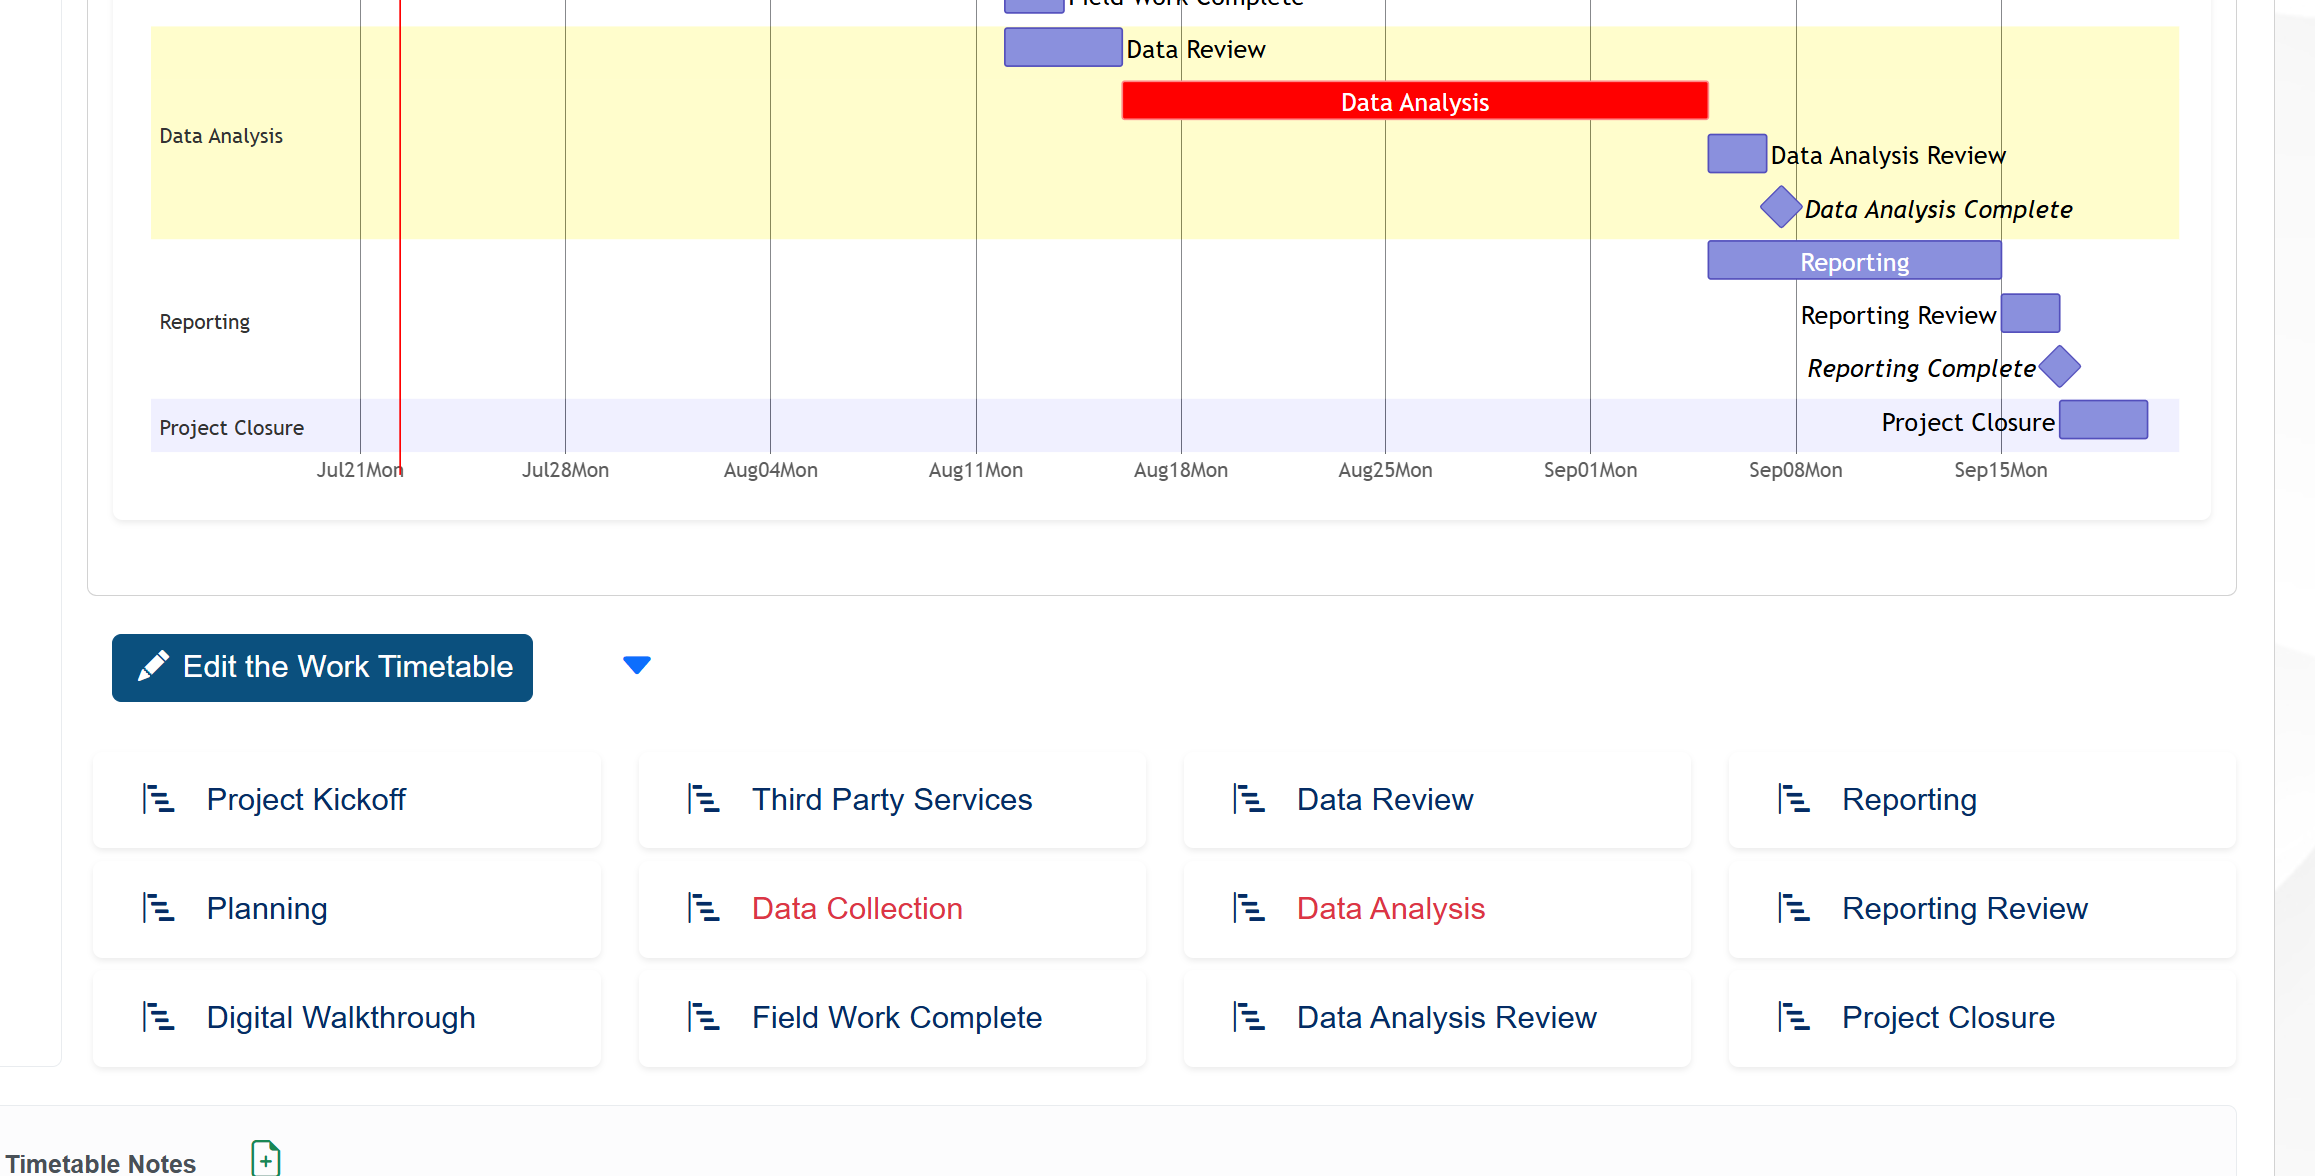
It’s possible to edit the chart using the Edit the Work Timetable button on the bottom left corner of the chart.
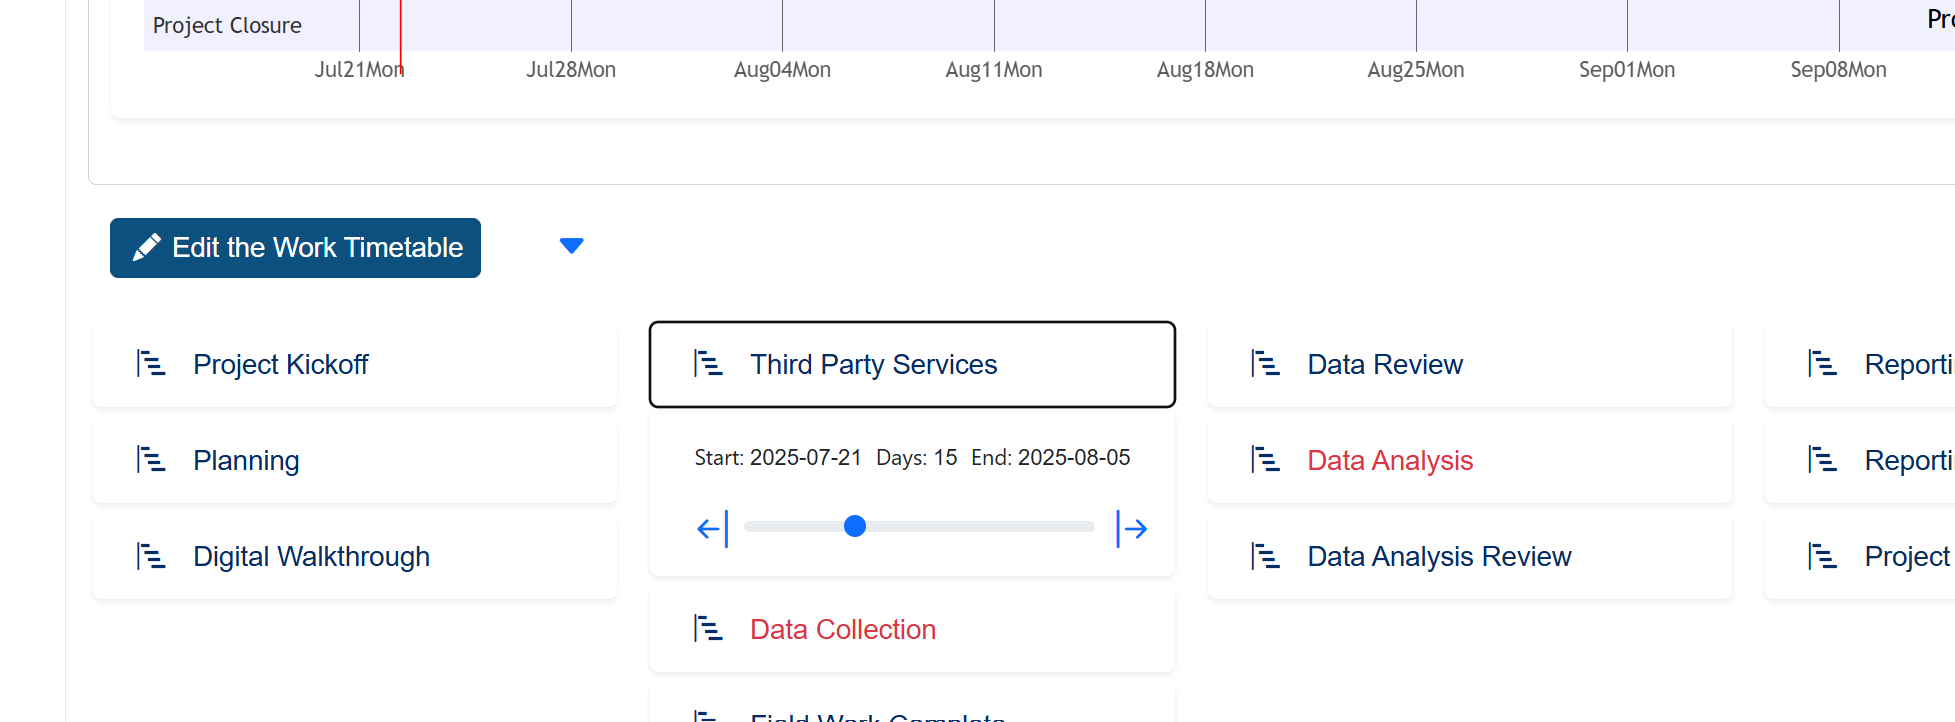
When clicked, the button expand control panels for the tasks and milestones, allowing the user to edit their information. The figure below displays the expanded view of the control panels.
To edit a task or milestone, click on its control panel title. The figure below shows an example of a task control panel for the Third Party Services panel.
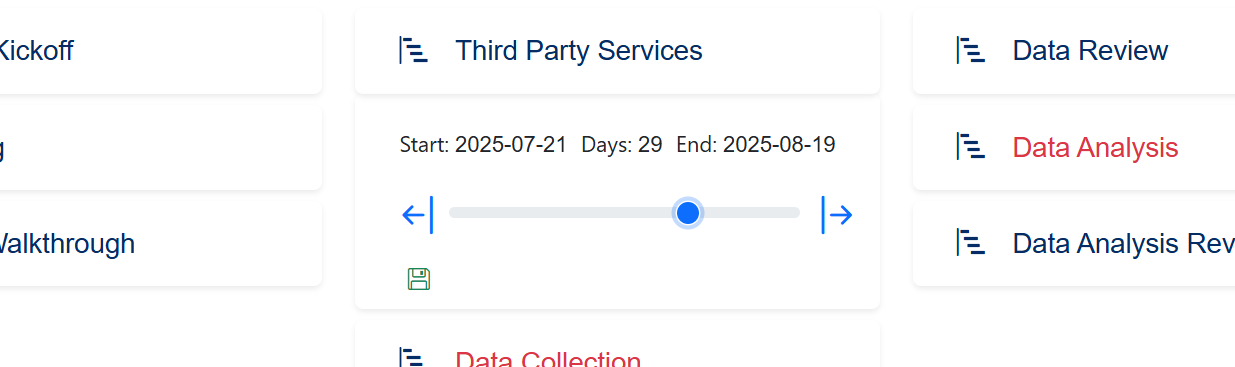
To change the task or milestone, drag the slider or use the arrow icons. When the task or milestone is changed, the Gantt chart is updated automatically. The figure below displays an example of the updated Gantt chart after changing the Third Party Services task.
It’s possible to collpase and expand the chart by clicking on the Collapse All and Expand All icons, respectively. The figure below shows the icons and an expanded view of the chart.